

Influence of Ballast Track on Vertical Response of Multi-span SS Bridges
7
Fig. 6. Experimental campaign photographs
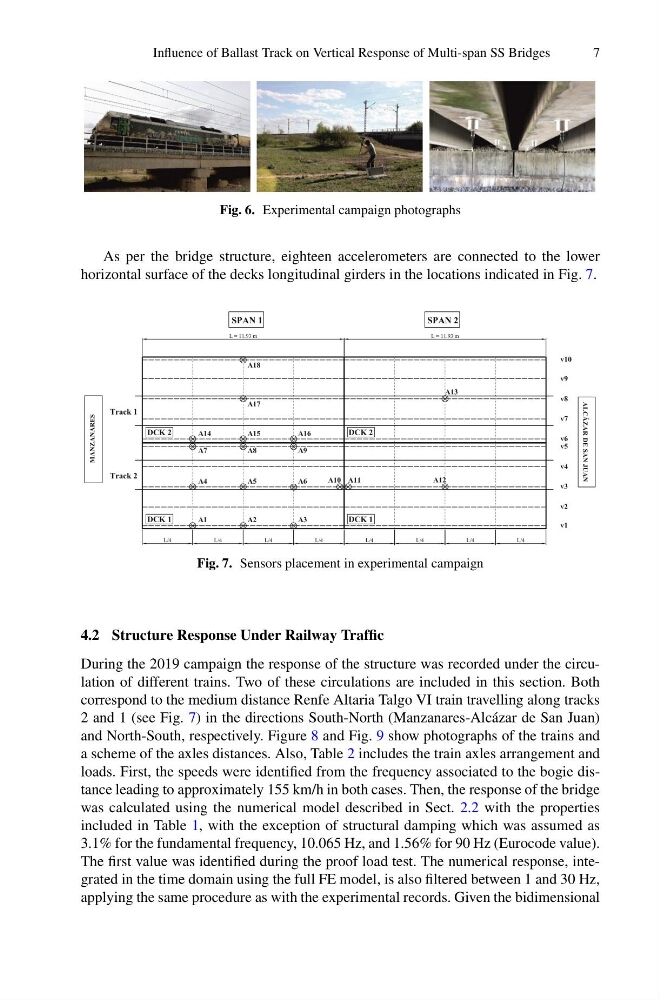
As per the bridge structure, eighteen accelerometers are connected to the lower
horizontal surface of the decks longitudinal girders in the locations indicated in Fig. 7.
SPAN 1
DCK 2
DCK 2
DCK 1
DCK 1
SPAN 2
Track 1
Track 2
Fig. 7. Sensors placement in experimental campaign
4.2 Structure Response Under Railway Traffic
During the 2019 campaign the response of the structure was recorded under the circulation of different trains. Two of these circulations are included in this section. Both
correspond to the medium distance Renfe Altaria Talgo VI train travelling along tracks
2 and 1 (see Fig. 7) in the directions South-North (Manzanares-Alcázar de San Juan)
and North-South, respectively. Figure 8 and Fig. 9 show photographs of the trains and
a scheme of the axles distances. Also, Table 2 includes the train axles arrangement and
loads. First, the speeds were identified from the frequency associated to the bogie distance leading to approximately 155 km/h in both cases. Then, the response of the bridge
was calculated using the numerical model described in Sect. 2.2 with the properties
included in Table 1, with the exception of structural damping which was assumed as
3.1% for the fundamental frequency, 10.065 Hz, and 1.56% for 90 Hz (Eurocode value).
The first value was identified during the proof load test. The numerical response, integrated in the time domain using the full FE model, is also filtered between 1 and 30 Hz,
applying the same procedure as with the experimental records. Given the bidimensional
7
Fig. 6. Experimental campaign photographs
As per the bridge structure, eighteen accelerometers are connected to the lower
horizontal surface of the decks longitudinal girders in the locations indicated in Fig. 7.
SPAN 1
DCK 2
DCK 2
DCK 1
DCK 1
SPAN 2
Track 1
Track 2
Fig. 7. Sensors placement in experimental campaign
4.2 Structure Response Under Railway Traffic
During the 2019 campaign the response of the structure was recorded under the circulation of different trains. Two of these circulations are included in this section. Both
correspond to the medium distance Renfe Altaria Talgo VI train travelling along tracks
2 and 1 (see Fig. 7) in the directions South-North (Manzanares-Alcázar de San Juan)
and North-South, respectively. Figure 8 and Fig. 9 show photographs of the trains and
a scheme of the axles distances. Also, Table 2 includes the train axles arrangement and
loads. First, the speeds were identified from the frequency associated to the bogie distance leading to approximately 155 km/h in both cases. Then, the response of the bridge
was calculated using the numerical model described in Sect. 2.2 with the properties
included in Table 1, with the exception of structural damping which was assumed as
3.1% for the fundamental frequency, 10.065 Hz, and 1.56% for 90 Hz (Eurocode value).
The first value was identified during the proof load test. The numerical response, integrated in the time domain using the full FE model, is also filtered between 1 and 30 Hz,
applying the same procedure as with the experimental records. Given the bidimensional