

50
C. R. Brune
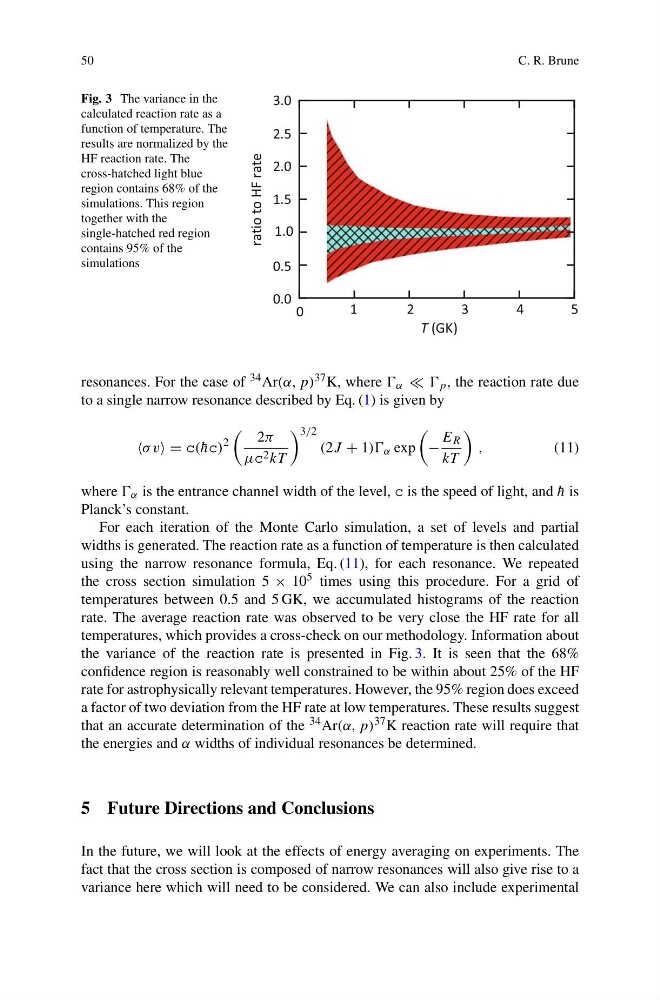
Fig. 3 The variance in the
calculated reaction rate as a
function of temperature. The
results are normalized by the
HF reaction rate. The
cross-hatched light blue
region contains 68% of the
simulations. This region
together with the
single-hatched red region
contains 95% of the
simulations
0
1
2
3
4
5
T (GK)
0.0
0.5
1.0
1.5
2.0
2.5
3.0
ratio to HF rate
resonances. For the case of 34 Ar(α, p) 37 K, where α p , the reaction rate due
to a single narrow resonance described by Eq. (1) is given by
σ v = c( ¯
hc)
2
2π
μc 2 kT
3/2
(2J + 1)) α exp
−
E R
kT
,
(11)
where α is the entrance channel width of the level, c is the speed of light, and ¯
h is
Planck’s constant.
For each iteration of the Monte Carlo simulation, a set of levels and partial
widths is generated. The reaction rate as a function of temperature is then calculated
using the narrow resonance formula, Eq. (11), for each resonance. We repeated
the cross section simulation 5 × 10 5 times using this procedure. For a grid of
temperatures between 0.5 and 5 GK, we accumulated histograms of the reaction
rate. The average reaction rate was observed to be very close the HF rate for all
temperatures, which provides a cross-check on our methodology. Information about
the variance of the reaction rate is presented in Fig. 3. It is seen that the 68%
confidence region is reasonably well constrained to be within about 25% of the HF
rate for astrophysically relevant temperatures. However, the 95% region does exceed
a factor of two deviation from the HF rate at low temperatures. These results suggest
that an accurate determination of the 34 Ar(α, p) 37 K reaction rate will require that
the energies and α widths of individual resonances be determined.
5 Future Directions and Conclusions
In the future, we will look at the effects of energy averaging on experiments. The
fact that the cross section is composed of narrow resonances will also give rise to a
variance here which will need to be considered. We can also include experimental
C. R. Brune
Fig. 3 The variance in the
calculated reaction rate as a
function of temperature. The
results are normalized by the
HF reaction rate. The
cross-hatched light blue
region contains 68% of the
simulations. This region
together with the
single-hatched red region
contains 95% of the
simulations
0
1
2
3
4
5
T (GK)
0.0
0.5
1.0
1.5
2.0
2.5
3.0
ratio to HF rate
resonances. For the case of 34 Ar(α, p) 37 K, where α p , the reaction rate due
to a single narrow resonance described by Eq. (1) is given by
σ v = c( ¯
hc)
2
2π
μc 2 kT
3/2
(2J + 1)) α exp
−
E R
kT
,
(11)
where α is the entrance channel width of the level, c is the speed of light, and ¯
h is
Planck’s constant.
For each iteration of the Monte Carlo simulation, a set of levels and partial
widths is generated. The reaction rate as a function of temperature is then calculated
using the narrow resonance formula, Eq. (11), for each resonance. We repeated
the cross section simulation 5 × 10 5 times using this procedure. For a grid of
temperatures between 0.5 and 5 GK, we accumulated histograms of the reaction
rate. The average reaction rate was observed to be very close the HF rate for all
temperatures, which provides a cross-check on our methodology. Information about
the variance of the reaction rate is presented in Fig. 3. It is seen that the 68%
confidence region is reasonably well constrained to be within about 25% of the HF
rate for astrophysically relevant temperatures. However, the 95% region does exceed
a factor of two deviation from the HF rate at low temperatures. These results suggest
that an accurate determination of the 34 Ar(α, p) 37 K reaction rate will require that
the energies and α widths of individual resonances be determined.
5 Future Directions and Conclusions
In the future, we will look at the effects of energy averaging on experiments. The
fact that the cross section is composed of narrow resonances will also give rise to a
variance here which will need to be considered. We can also include experimental