

290
J.-F. Lemaître et al.
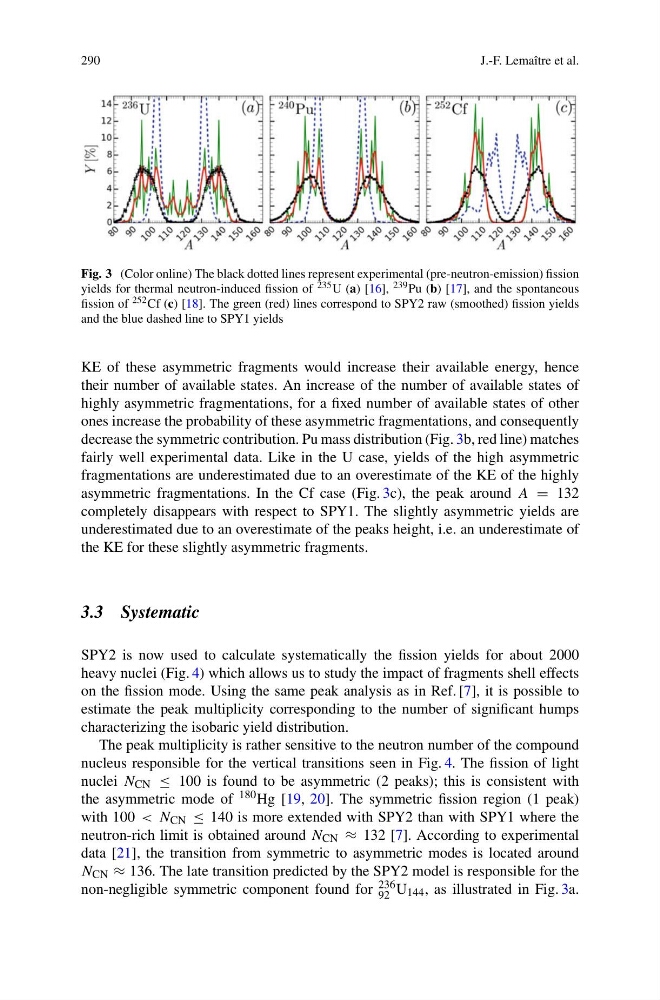
Fig. 3 (Color online) The black dotted lines represent experimental (pre-neutron-emission) fission
yields for thermal neutron-induced fission of 235 U (a) [16], 239 Pu (b) [17], and the spontaneous
fission of 252 Cf (c) [18]. The green (red) lines correspond to SPY2 raw (smoothed) fission yields
and the blue dashed line to SPY1 yields
KE of these asymmetric fragments would increase their available energy, hence
their number of available states. An increase of the number of available states of
highly asymmetric fragmentations, for a fixed number of available states of other
ones increase the probability of these asymmetric fragmentations, and consequently
decrease the symmetric contribution. Pu mass distribution (Fig. 3b, red line) matches
fairly well experimental data. Like in the U case, yields of the high asymmetric
fragmentations are underestimated due to an overestimate of the KE of the highly
asymmetric fragmentations. In the Cf case (Fig. 3c), the peak around A = 132
completely disappears with respect to SPY1. The slightly asymmetric yields are
underestimated due to an overestimate of the peaks height, i.e. an underestimate of
the KE for these slightly asymmetric fragments.
3.3 Systematic
SPY2 is now used to calculate systematically the fission yields for about 2000
heavy nuclei (Fig. 4) which allows us to study the impact of fragments shell effects
on the fission mode. Using the same peak analysis as in Ref. [7], it is possible to
estimate the peak multiplicity corresponding to the number of significant humps
characterizing the isobaric yield distribution.
The peak multiplicity is rather sensitive to the neutron number of the compound
nucleus responsible for the vertical transitions seen in Fig. 4. The fission of light
nuclei N CN ≤ 100 is found to be asymmetric (2 peaks); this is consistent with
the asymmetric mode of 180 Hg [19, 20]. The symmetric fission region (1 peak)
with 100 < N CN ≤ 140 is more extended with SPY2 than with SPY1 where the
neutron-rich limit is obtained around N CN ≈ 132 [7]. According to experimental
data [21], the transition from symmetric to asymmetric modes is located around
N CN ≈ 136. The late transition predicted by the SPY2 model is responsible for the
non-negligible symmetric component found for 236
92 U 144 , as illustrated in Fig. 3a.
J.-F. Lemaître et al.
Fig. 3 (Color online) The black dotted lines represent experimental (pre-neutron-emission) fission
yields for thermal neutron-induced fission of 235 U (a) [16], 239 Pu (b) [17], and the spontaneous
fission of 252 Cf (c) [18]. The green (red) lines correspond to SPY2 raw (smoothed) fission yields
and the blue dashed line to SPY1 yields
KE of these asymmetric fragments would increase their available energy, hence
their number of available states. An increase of the number of available states of
highly asymmetric fragmentations, for a fixed number of available states of other
ones increase the probability of these asymmetric fragmentations, and consequently
decrease the symmetric contribution. Pu mass distribution (Fig. 3b, red line) matches
fairly well experimental data. Like in the U case, yields of the high asymmetric
fragmentations are underestimated due to an overestimate of the KE of the highly
asymmetric fragmentations. In the Cf case (Fig. 3c), the peak around A = 132
completely disappears with respect to SPY1. The slightly asymmetric yields are
underestimated due to an overestimate of the peaks height, i.e. an underestimate of
the KE for these slightly asymmetric fragments.
3.3 Systematic
SPY2 is now used to calculate systematically the fission yields for about 2000
heavy nuclei (Fig. 4) which allows us to study the impact of fragments shell effects
on the fission mode. Using the same peak analysis as in Ref. [7], it is possible to
estimate the peak multiplicity corresponding to the number of significant humps
characterizing the isobaric yield distribution.
The peak multiplicity is rather sensitive to the neutron number of the compound
nucleus responsible for the vertical transitions seen in Fig. 4. The fission of light
nuclei N CN ≤ 100 is found to be asymmetric (2 peaks); this is consistent with
the asymmetric mode of 180 Hg [19, 20]. The symmetric fission region (1 peak)
with 100 < N CN ≤ 140 is more extended with SPY2 than with SPY1 where the
neutron-rich limit is obtained around N CN ≈ 132 [7]. According to experimental
data [21], the transition from symmetric to asymmetric modes is located around
N CN ≈ 136. The late transition predicted by the SPY2 model is responsible for the
non-negligible symmetric component found for 236
92 U 144 , as illustrated in Fig. 3a.