

204
J. E. Midtbø et al.
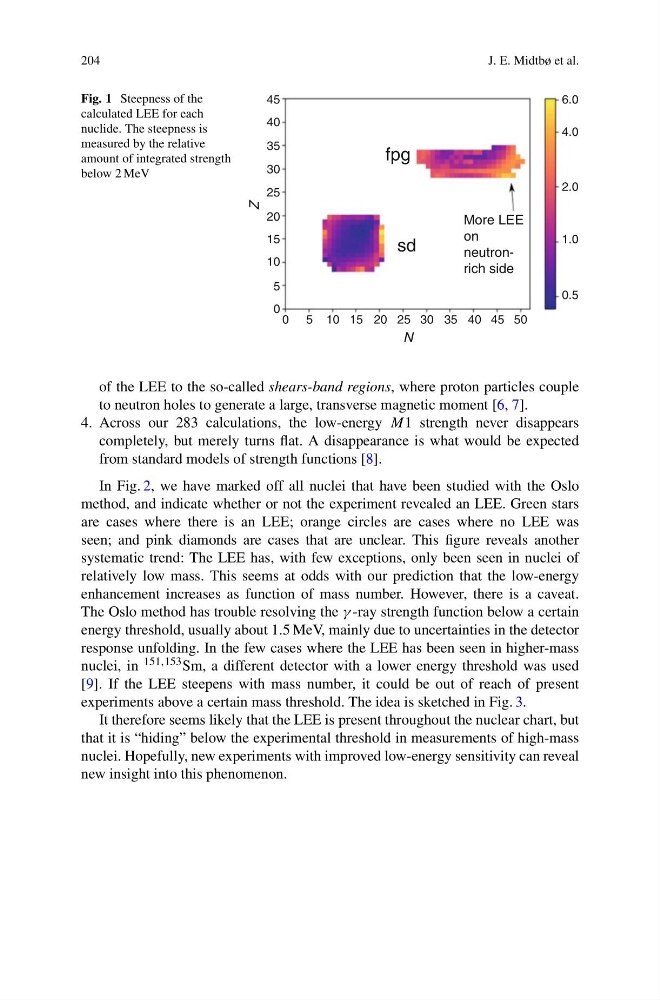
Fig. 1 Steepness of the
calculated LEE for each
nuclide. The steepness is
measured by the relative
amount of integrated strength
below 2 MeV
50
6.0
4.0
2.0
1.0
0.5
45
40
35
30
More LEE
on
neutronrich side
fpg
sd
25
N
Z
20
15
10
5
0
45
40
35
30
25
20
15
10
5
0
of the LEE to the so-called shears-band regions, where proton particles couple
to neutron holes to generate a large, transverse magnetic moment [6, 7].
4. Across our 283 calculations, the low-energy M1 strength never disappears
completely, but merely turns flat. A disappearance is what would be expected
from standard models of strength functions [8].
In Fig. 2, we have marked off all nuclei that have been studied with the Oslo
method, and indicate whether or not the experiment revealed an LEE. Green stars
are cases where there is an LEE; orange circles are cases where no LEE was
seen; and pink diamonds are cases that are unclear. This figure reveals another
systematic trend: The LEE has, with few exceptions, only been seen in nuclei of
relatively low mass. This seems at odds with our prediction that the low-energy
enhancement increases as function of mass number. However, there is a caveat.
The Oslo method has trouble resolving the γ -ray strength function below a certain
energy threshold, usually about 1.5 MeV, mainly due to uncertainties in the detector
response unfolding. In the few cases where the LEE has been seen in higher-mass
nuclei, in 151,153 Sm, a different detector with a lower energy threshold was used
[9]. If the LEE steepens with mass number, it could be out of reach of present
experiments above a certain mass threshold. The idea is sketched in Fig. 3.
It therefore seems likely that the LEE is present throughout the nuclear chart, but
that it is “hiding” below the experimental threshold in measurements of high-mass
nuclei. Hopefully, new experiments with improved low-energy sensitivity can reveal
new insight into this phenomenon.
J. E. Midtbø et al.
Fig. 1 Steepness of the
calculated LEE for each
nuclide. The steepness is
measured by the relative
amount of integrated strength
below 2 MeV
50
6.0
4.0
2.0
1.0
0.5
45
40
35
30
More LEE
on
neutronrich side
fpg
sd
25
N
Z
20
15
10
5
0
45
40
35
30
25
20
15
10
5
0
of the LEE to the so-called shears-band regions, where proton particles couple
to neutron holes to generate a large, transverse magnetic moment [6, 7].
4. Across our 283 calculations, the low-energy M1 strength never disappears
completely, but merely turns flat. A disappearance is what would be expected
from standard models of strength functions [8].
In Fig. 2, we have marked off all nuclei that have been studied with the Oslo
method, and indicate whether or not the experiment revealed an LEE. Green stars
are cases where there is an LEE; orange circles are cases where no LEE was
seen; and pink diamonds are cases that are unclear. This figure reveals another
systematic trend: The LEE has, with few exceptions, only been seen in nuclei of
relatively low mass. This seems at odds with our prediction that the low-energy
enhancement increases as function of mass number. However, there is a caveat.
The Oslo method has trouble resolving the γ -ray strength function below a certain
energy threshold, usually about 1.5 MeV, mainly due to uncertainties in the detector
response unfolding. In the few cases where the LEE has been seen in higher-mass
nuclei, in 151,153 Sm, a different detector with a lower energy threshold was used
[9]. If the LEE steepens with mass number, it could be out of reach of present
experiments above a certain mass threshold. The idea is sketched in Fig. 3.
It therefore seems likely that the LEE is present throughout the nuclear chart, but
that it is “hiding” below the experimental threshold in measurements of high-mass
nuclei. Hopefully, new experiments with improved low-energy sensitivity can reveal
new insight into this phenomenon.