

Deconvolution of the Photon Strength Function
181
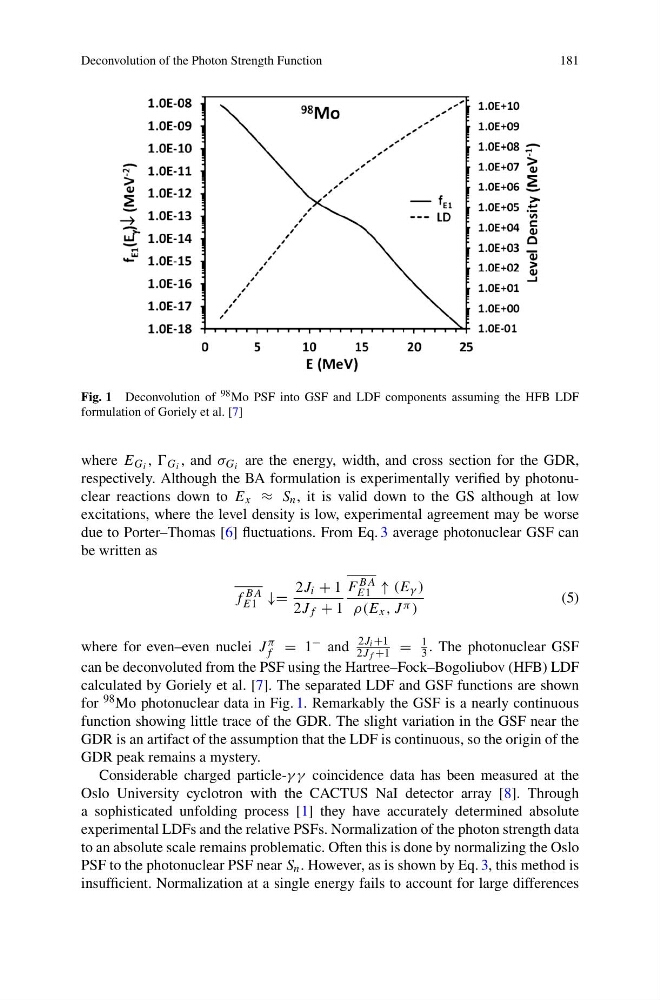
Fig. 1 Deconvolution of 98 Mo PSF into GSF and LDF components assuming the HFB LDF
formulation of Goriely et al. [7]
where E G i , G i , and σ G i are the energy, width, and cross section for the GDR,
respectively. Although the BA formulation is experimentally verified by photonuclear reactions down to E x ≈ S n , it is valid down to the GS although at low
excitations, where the level density is low, experimental agreement may be worse
due to Porter–Thomas [6] fluctuations. From Eq. 3 average photonuclear GSF can
be written as
f BA
E1 ↓=
2J i + 1
2J f + 1
F BA
E1 ↑ (E γ )
ρ(E x , J π )
(5)
where for even–even nuclei J π
f = 1 − and
2J i +1
2J f +1 =
1
3 . The photonuclear GSF
can be deconvoluted from the PSF using the Hartree–Fock–Bogoliubov (HFB) LDF
calculated by Goriely et al. [7]. The separated LDF and GSF functions are shown
for 98 Mo photonuclear data in Fig. 1. Remarkably the GSF is a nearly continuous
function showing little trace of the GDR. The slight variation in the GSF near the
GDR is an artifact of the assumption that the LDF is continuous, so the origin of the
GDR peak remains a mystery.
Considerable charged particle-γ γ coincidence data has been measured at the
Oslo University cyclotron with the CACTUS NaI detector array [8]. Through
a sophisticated unfolding process [1] they have accurately determined absolute
experimental LDFs and the relative PSFs. Normalization of the photon strength data
to an absolute scale remains problematic. Often this is done by normalizing the Oslo
PSF to the photonuclear PSF near S n . However, as is shown by Eq. 3, this method is
insufficient. Normalization at a single energy fails to account for large differences
181
Fig. 1 Deconvolution of 98 Mo PSF into GSF and LDF components assuming the HFB LDF
formulation of Goriely et al. [7]
where E G i , G i , and σ G i are the energy, width, and cross section for the GDR,
respectively. Although the BA formulation is experimentally verified by photonuclear reactions down to E x ≈ S n , it is valid down to the GS although at low
excitations, where the level density is low, experimental agreement may be worse
due to Porter–Thomas [6] fluctuations. From Eq. 3 average photonuclear GSF can
be written as
f BA
E1 ↓=
2J i + 1
2J f + 1
F BA
E1 ↑ (E γ )
ρ(E x , J π )
(5)
where for even–even nuclei J π
f = 1 − and
2J i +1
2J f +1 =
1
3 . The photonuclear GSF
can be deconvoluted from the PSF using the Hartree–Fock–Bogoliubov (HFB) LDF
calculated by Goriely et al. [7]. The separated LDF and GSF functions are shown
for 98 Mo photonuclear data in Fig. 1. Remarkably the GSF is a nearly continuous
function showing little trace of the GDR. The slight variation in the GSF near the
GDR is an artifact of the assumption that the LDF is continuous, so the origin of the
GDR peak remains a mystery.
Considerable charged particle-γ γ coincidence data has been measured at the
Oslo University cyclotron with the CACTUS NaI detector array [8]. Through
a sophisticated unfolding process [1] they have accurately determined absolute
experimental LDFs and the relative PSFs. Normalization of the photon strength data
to an absolute scale remains problematic. Often this is done by normalizing the Oslo
PSF to the photonuclear PSF near S n . However, as is shown by Eq. 3, this method is
insufficient. Normalization at a single energy fails to account for large differences