

3 Dynamics of Spray Granulation in Continuously …
85
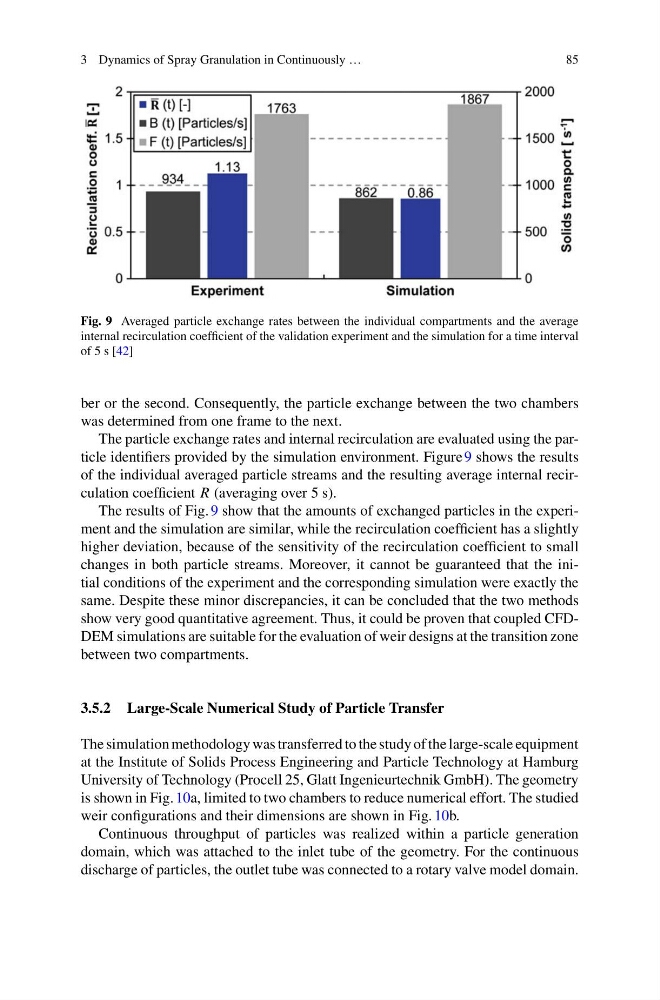
Fig. 9 Averaged particle exchange rates between the individual compartments and the average
internal recirculation coefficient of the validation experiment and the simulation for a time interval
of 5 s [42]
ber or the second. Consequently, the particle exchange between the two chambers
was determined from one frame to the next.
The particle exchange rates and internal recirculation are evaluated using the particle identifiers provided by the simulation environment. Figure 9 shows the results
of the individual averaged particle streams and the resulting average internal recirculation coefficient R (averaging over 5 s).
The results of Fig. 9 show that the amounts of exchanged particles in the experiment and the simulation are similar, while the recirculation coefficient has a slightly
higher deviation, because of the sensitivity of the recirculation coefficient to small
changes in both particle streams. Moreover, it cannot be guaranteed that the initial conditions of the experiment and the corresponding simulation were exactly the
same. Despite these minor discrepancies, it can be concluded that the two methods
show very good quantitative agreement. Thus, it could be proven that coupled CFDDEM simulations are suitable for the evaluation of weir designs at the transition zone
between two compartments.
3.5.2 Large-Scale Numerical Study of Particle Transfer
The simulation methodology was transferred to the study of the large-scale equipment
at the Institute of Solids Process Engineering and Particle Technology at Hamburg
University of Technology (Procell 25, Glatt Ingenieurtechnik GmbH). The geometry
is shown in Fig. 10a, limited to two chambers to reduce numerical effort. The studied
weir configurations and their dimensions are shown in Fig. 10b.
Continuous throughput of particles was realized within a particle generation
domain, which was attached to the inlet tube of the geometry. For the continuous
discharge of particles, the outlet tube was connected to a rotary valve model domain.
85
Fig. 9 Averaged particle exchange rates between the individual compartments and the average
internal recirculation coefficient of the validation experiment and the simulation for a time interval
of 5 s [42]
ber or the second. Consequently, the particle exchange between the two chambers
was determined from one frame to the next.
The particle exchange rates and internal recirculation are evaluated using the particle identifiers provided by the simulation environment. Figure 9 shows the results
of the individual averaged particle streams and the resulting average internal recirculation coefficient R (averaging over 5 s).
The results of Fig. 9 show that the amounts of exchanged particles in the experiment and the simulation are similar, while the recirculation coefficient has a slightly
higher deviation, because of the sensitivity of the recirculation coefficient to small
changes in both particle streams. Moreover, it cannot be guaranteed that the initial conditions of the experiment and the corresponding simulation were exactly the
same. Despite these minor discrepancies, it can be concluded that the two methods
show very good quantitative agreement. Thus, it could be proven that coupled CFDDEM simulations are suitable for the evaluation of weir designs at the transition zone
between two compartments.
3.5.2 Large-Scale Numerical Study of Particle Transfer
The simulation methodology was transferred to the study of the large-scale equipment
at the Institute of Solids Process Engineering and Particle Technology at Hamburg
University of Technology (Procell 25, Glatt Ingenieurtechnik GmbH). The geometry
is shown in Fig. 10a, limited to two chambers to reduce numerical effort. The studied
weir configurations and their dimensions are shown in Fig. 10b.
Continuous throughput of particles was realized within a particle generation
domain, which was attached to the inlet tube of the geometry. For the continuous
discharge of particles, the outlet tube was connected to a rotary valve model domain.