

622
V. Skorych et al.
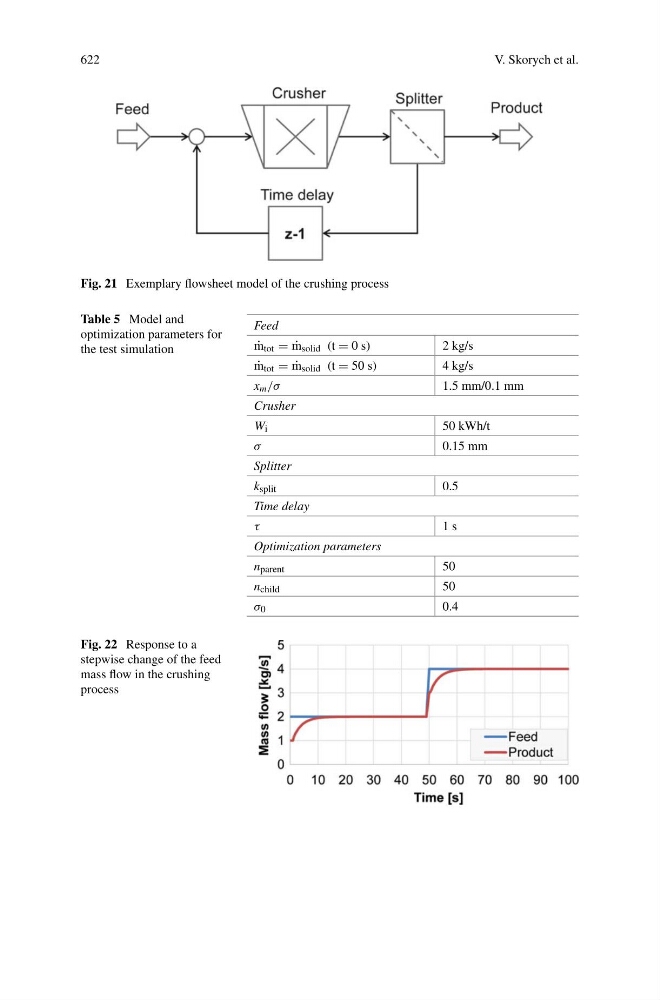
Fig. 21 Exemplary flowsheet model of the crushing process
Table 5 Model and
optimization parameters for
the test simulation
Feed
˙
m tot = ˙
m solid (t = 0 s)
2 kg/s
˙
m tot = ˙
m solid (t = 50 s)
4 kg/s
x m /σ
1.5 mm/0.1 mm
Crusher
W i
50 kWh/t
σ
0.15 mm
Splitter
k split
0.5
Time delay
τ
1 s
Optimization parameters
n parent
50
n child
50
σ 0
0.4
Fig. 22 Response to a
stepwise change of the feed
mass flow in the crushing
process