

13 Morphological Modelling and Simulation …
465
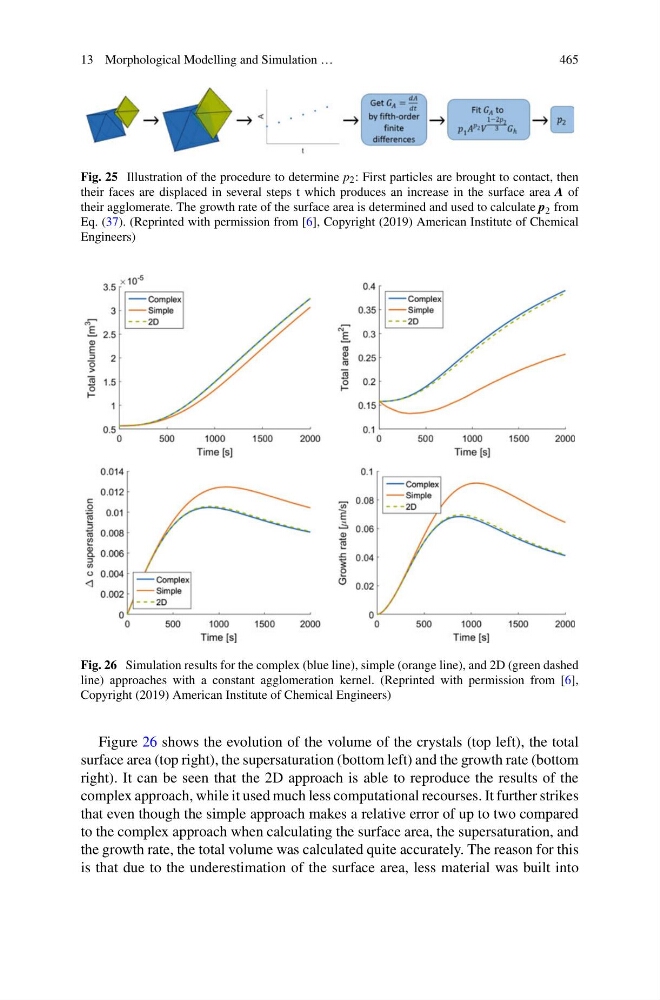
Fig. 25 Illustration of the procedure to determine p 2 : First particles are brought to contact, then
their faces are displaced in several steps t which produces an increase in the surface area A of
their agglomerate. The growth rate of the surface area is determined and used to calculate p 2 from
Eq. (37). (Reprinted with permission from [6], Copyright (2019) American Institute of Chemical
Engineers)
Fig. 26 Simulation results for the complex (blue line), simple (orange line), and 2D (green dashed
line) approaches with a constant agglomeration kernel. (Reprinted with permission from [6],
Copyright (2019) American Institute of Chemical Engineers)
Figure 26 shows the evolution of the volume of the crystals (top left), the total
surface area (top right), the supersaturation (bottom left) and the growth rate (bottom
right). It can be seen that the 2D approach is able to reproduce the results of the
complex approach, while it used much less computational recourses. It further strikes
that even though the simple approach makes a relative error of up to two compared
to the complex approach when calculating the surface area, the supersaturation, and
the growth rate, the total volume was calculated quite accurately. The reason for this
is that due to the underestimation of the surface area, less material was built into
465
Fig. 25 Illustration of the procedure to determine p 2 : First particles are brought to contact, then
their faces are displaced in several steps t which produces an increase in the surface area A of
their agglomerate. The growth rate of the surface area is determined and used to calculate p 2 from
Eq. (37). (Reprinted with permission from [6], Copyright (2019) American Institute of Chemical
Engineers)
Fig. 26 Simulation results for the complex (blue line), simple (orange line), and 2D (green dashed
line) approaches with a constant agglomeration kernel. (Reprinted with permission from [6],
Copyright (2019) American Institute of Chemical Engineers)
Figure 26 shows the evolution of the volume of the crystals (top left), the total
surface area (top right), the supersaturation (bottom left) and the growth rate (bottom
right). It can be seen that the 2D approach is able to reproduce the results of the
complex approach, while it used much less computational recourses. It further strikes
that even though the simple approach makes a relative error of up to two compared
to the complex approach when calculating the surface area, the supersaturation, and
the growth rate, the total volume was calculated quite accurately. The reason for this
is that due to the underestimation of the surface area, less material was built into