

12 Property Function to Compute the Dustiness of Powders
429
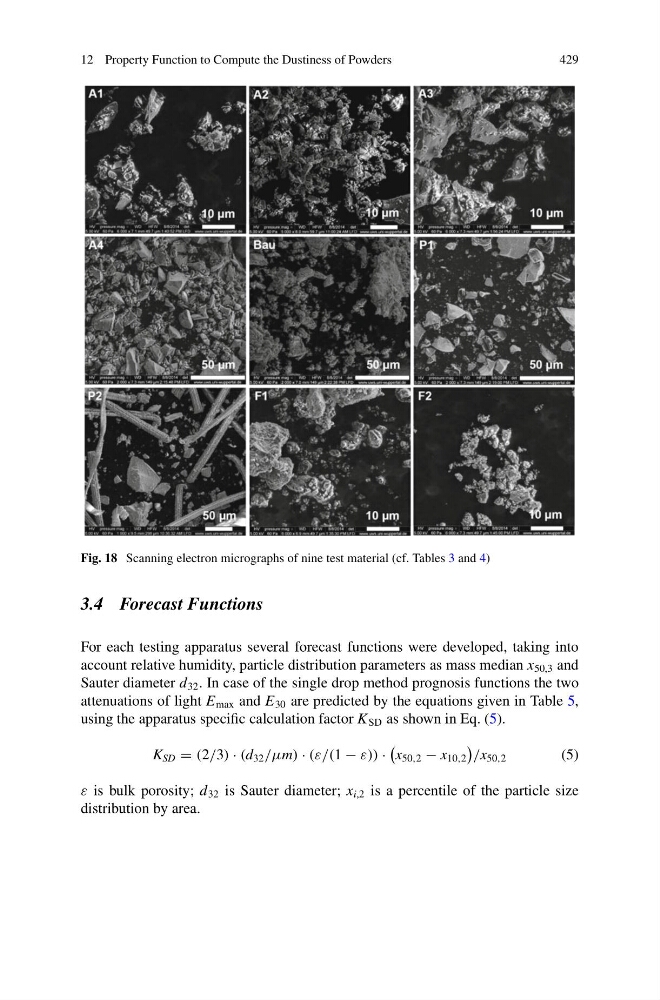
Fig. 18 Scanning electron micrographs of nine test material (cf. Tables 3 and 4)
3.4 Forecast Functions
For each testing apparatus several forecast functions were developed, taking into
account relative humidity, particle distribution parameters as mass median x 50,3 and
Sauter diameter d 32 . In case of the single drop method prognosis functions the two
attenuations of light E max and E 30 are predicted by the equations given in Table 5,
using the apparatus specific calculation factor K SD as shown in Eq. (5).
K SD = (2/3) · (d 32 /μm) · (ε/(1 − ε)) ·
x 50,2 − x 10,2
/x 50,2
(5)
ε is bulk porosity; d 32 is Sauter diameter; x i,2 is a percentile of the particle size
distribution by area.
429
Fig. 18 Scanning electron micrographs of nine test material (cf. Tables 3 and 4)
3.4 Forecast Functions
For each testing apparatus several forecast functions were developed, taking into
account relative humidity, particle distribution parameters as mass median x 50,3 and
Sauter diameter d 32 . In case of the single drop method prognosis functions the two
attenuations of light E max and E 30 are predicted by the equations given in Table 5,
using the apparatus specific calculation factor K SD as shown in Eq. (5).
K SD = (2/3) · (d 32 /μm) · (ε/(1 − ε)) ·
x 50,2 − x 10,2
/x 50,2
(5)
ε is bulk porosity; d 32 is Sauter diameter; x i,2 is a percentile of the particle size
distribution by area.