

424
K. Vaupel et al.
Referring to Table 2, it can be seen that the predicted dustiness tendencies deviate
significantly from the measured dust releases. This indicates, that the test materials,
that underlie the prediction formula used, do not adequately represent the dusting
properties of the investigated materials.
3 Development of Dustiness Forecast Functions
3.1 Introduction
At Bergische Universität Wuppertal dustiness forecast functions based on experiments with single drop method, rotating drum method and the UNC dustiness tester
were developed [6]. These prognosis functions will allow estimations of dust formation tendency by means of distribution and material specific parameters for dry and
moist materials and are implemented into the newly developed DYSSOL flow sheet
simulation [7].
3.2 Testing Methods
3.2.1 Single Drop Method
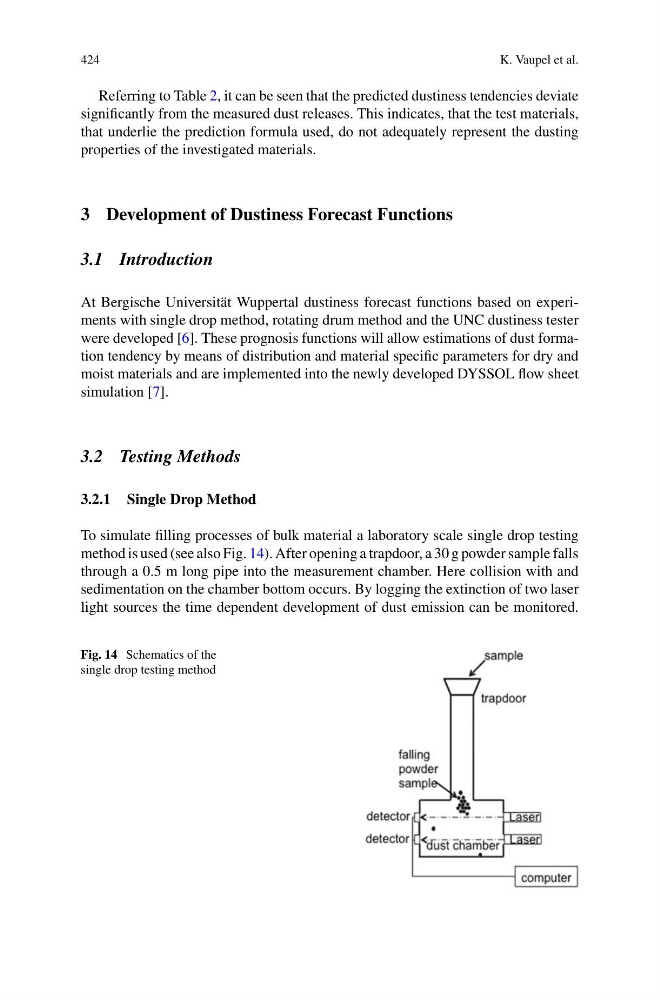
To simulate filling processes of bulk material a laboratory scale single drop testing
method is used (see also Fig. 14). After opening a trapdoor, a 30 g powder sample falls
through a 0.5 m long pipe into the measurement chamber. Here collision with and
sedimentation on the chamber bottom occurs. By logging the extinction of two laser
light sources the time dependent development of dust emission can be monitored.
Fig. 14 Schematics of the
single drop testing method
K. Vaupel et al.
Referring to Table 2, it can be seen that the predicted dustiness tendencies deviate
significantly from the measured dust releases. This indicates, that the test materials,
that underlie the prediction formula used, do not adequately represent the dusting
properties of the investigated materials.
3 Development of Dustiness Forecast Functions
3.1 Introduction
At Bergische Universität Wuppertal dustiness forecast functions based on experiments with single drop method, rotating drum method and the UNC dustiness tester
were developed [6]. These prognosis functions will allow estimations of dust formation tendency by means of distribution and material specific parameters for dry and
moist materials and are implemented into the newly developed DYSSOL flow sheet
simulation [7].
3.2 Testing Methods
3.2.1 Single Drop Method
To simulate filling processes of bulk material a laboratory scale single drop testing
method is used (see also Fig. 14). After opening a trapdoor, a 30 g powder sample falls
through a 0.5 m long pipe into the measurement chamber. Here collision with and
sedimentation on the chamber bottom occurs. By logging the extinction of two laser
light sources the time dependent development of dust emission can be monitored.
Fig. 14 Schematics of the
single drop testing method