

10 Dynamics of Separation Characteristics of Sieving and Flow …
387
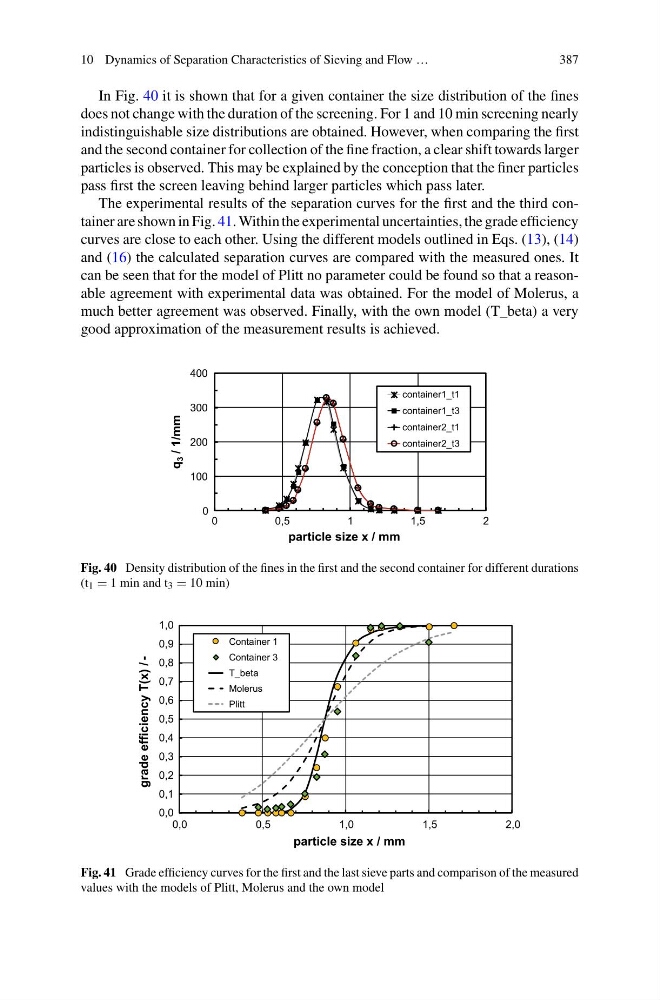
In Fig. 40 it is shown that for a given container the size distribution of the fines
does not change with the duration of the screening. For 1 and 10 min screening nearly
indistinguishable size distributions are obtained. However, when comparing the first
and the second container for collection of the fine fraction, a clear shift towards larger
particles is observed. This may be explained by the conception that the finer particles
pass first the screen leaving behind larger particles which pass later.
The experimental results of the separation curves for the first and the third container are shown in Fig. 41. Within the experimental uncertainties, the grade efficiency
curves are close to each other. Using the different models outlined in Eqs. (13), (14)
and (16) the calculated separation curves are compared with the measured ones. It
can be seen that for the model of Plitt no parameter could be found so that a reasonable agreement with experimental data was obtained. For the model of Molerus, a
much better agreement was observed. Finally, with the own model (T_beta) a very
good approximation of the measurement results is achieved.
0
100
200
300
400
0
0,5
1
1,5
2
q
3 / 1/mm
particle size x / mm
container1_t1
container1_t3
container2_t1
container2_t3
Fig. 40 Density distribution of the fines in the first and the second container for different durations
(t 1 = 1 min and t 3 = 10 min)
0,0
0,1
0,2
0,3
0,4
0,5
0,6
0,7
0,8
0,9
1,0
0,0
0,5
1,0
1,5
2,0
grade efficiency T(x) / -
particle size x / mm
Container 1
Container 3
T_beta
Molerus
Plitt
Fig. 41 Grade efficiency curves for the first and the last sieve parts and comparison of the measured
values with the models of Plitt, Molerus and the own model
387
In Fig. 40 it is shown that for a given container the size distribution of the fines
does not change with the duration of the screening. For 1 and 10 min screening nearly
indistinguishable size distributions are obtained. However, when comparing the first
and the second container for collection of the fine fraction, a clear shift towards larger
particles is observed. This may be explained by the conception that the finer particles
pass first the screen leaving behind larger particles which pass later.
The experimental results of the separation curves for the first and the third container are shown in Fig. 41. Within the experimental uncertainties, the grade efficiency
curves are close to each other. Using the different models outlined in Eqs. (13), (14)
and (16) the calculated separation curves are compared with the measured ones. It
can be seen that for the model of Plitt no parameter could be found so that a reasonable agreement with experimental data was obtained. For the model of Molerus, a
much better agreement was observed. Finally, with the own model (T_beta) a very
good approximation of the measurement results is achieved.
0
100
200
300
400
0
0,5
1
1,5
2
q
3 / 1/mm
particle size x / mm
container1_t1
container1_t3
container2_t1
container2_t3
Fig. 40 Density distribution of the fines in the first and the second container for different durations
(t 1 = 1 min and t 3 = 10 min)
0,0
0,1
0,2
0,3
0,4
0,5
0,6
0,7
0,8
0,9
1,0
0,0
0,5
1,0
1,5
2,0
grade efficiency T(x) / -
particle size x / mm
Container 1
Container 3
T_beta
Molerus
Plitt
Fig. 41 Grade efficiency curves for the first and the last sieve parts and comparison of the measured
values with the models of Plitt, Molerus and the own model