

6 Dynamic Process Models for Fine Grinding and Dispersing
219
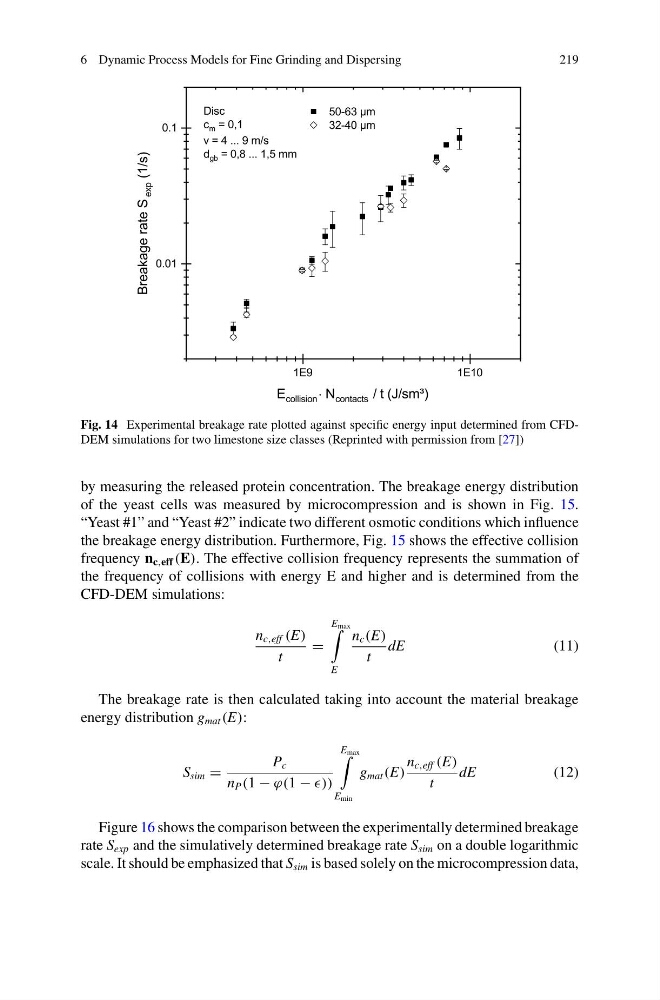
Fig. 14 Experimental breakage rate plotted against specific energy input determined from CFDDEM simulations for two limestone size classes (Reprinted with permission from [27])
by measuring the released protein concentration. The breakage energy distribution
of the yeast cells was measured by microcompression and is shown in Fig. 15.
“Yeast #1” and “Yeast #2” indicate two different osmotic conditions which influence
the breakage energy distribution. Furthermore, Fig. 15 shows the effective collision
frequency n c,eff (E). The effective collision frequency represents the summation of
the frequency of collisions with energy E and higher and is determined from the
CFD-DEM simulations:
n c,eff (E)
t
=
E max
E
n c (E)
t
dE
(11)
The breakage rate is then calculated taking into account the material breakage
energy distribution g mat (E):
S sim =
P c
n P (1 − ϕ(1 − ))
E max
E min
g mat (E)
n c,eff (E)
t
dE
(12)
Figure 16 shows the comparison between the experimentally determined breakage
rate S exp and the simulatively determined breakage rate S sim on a double logarithmic
scale. It should be emphasized that S sim is based solely on the microcompression data,
219
Fig. 14 Experimental breakage rate plotted against specific energy input determined from CFDDEM simulations for two limestone size classes (Reprinted with permission from [27])
by measuring the released protein concentration. The breakage energy distribution
of the yeast cells was measured by microcompression and is shown in Fig. 15.
“Yeast #1” and “Yeast #2” indicate two different osmotic conditions which influence
the breakage energy distribution. Furthermore, Fig. 15 shows the effective collision
frequency n c,eff (E). The effective collision frequency represents the summation of
the frequency of collisions with energy E and higher and is determined from the
CFD-DEM simulations:
n c,eff (E)
t
=
E max
E
n c (E)
t
dE
(11)
The breakage rate is then calculated taking into account the material breakage
energy distribution g mat (E):
S sim =
P c
n P (1 − ϕ(1 − ))
E max
E min
g mat (E)
n c,eff (E)
t
dE
(12)
Figure 16 shows the comparison between the experimentally determined breakage
rate S exp and the simulatively determined breakage rate S sim on a double logarithmic
scale. It should be emphasized that S sim is based solely on the microcompression data,