

5 Development of a Dynamic-Physical Process Model for Sieving
191
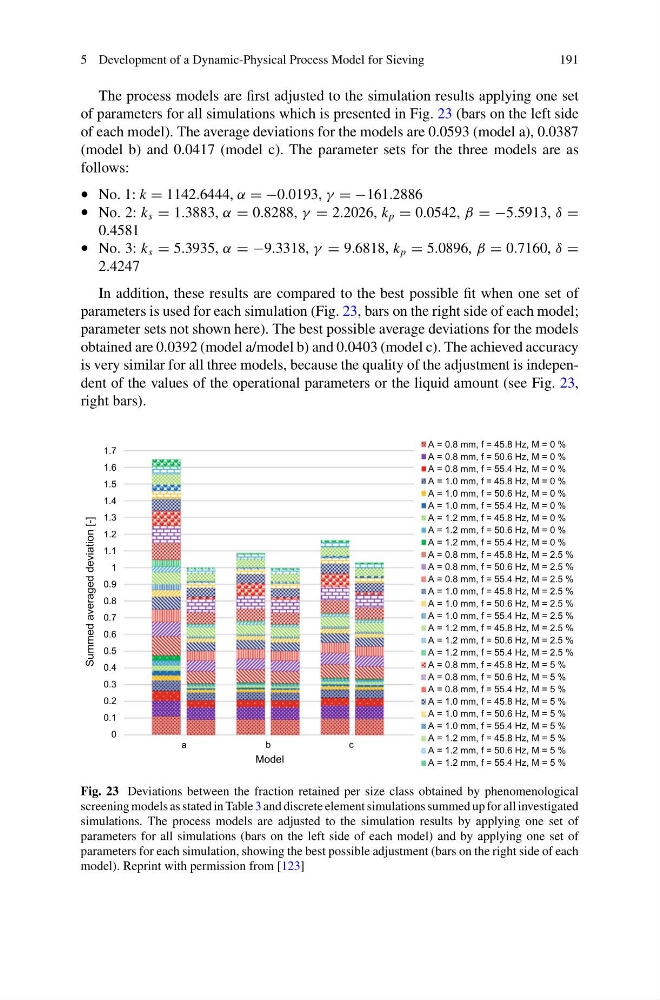
The process models are first adjusted to the simulation results applying one set
of parameters for all simulations which is presented in Fig. 23 (bars on the left side
of each model). The average deviations for the models are 0.0593 (model a), 0.0387
(model b) and 0.0417 (model c). The parameter sets for the three models are as
follows:
• No. 1: k = 1142.6444, α = −0.0193, γ = −161.2886
• No. 2: k s = 1.3883, α = 0.8288, γ = 2.2026, k p = 0.0542, β = −5.5913, δ =
0.4581
• No. 3: k s = 5.3935, α = −9.3318, γ = 9.6818, k p = 5.0896, β = 0.7160, δ =
2.4247
In addition, these results are compared to the best possible fit when one set of
parameters is used for each simulation (Fig. 23, bars on the right side of each model;
parameter sets not shown here). The best possible average deviations for the models
obtained are 0.0392 (model a/model b) and 0.0403 (model c). The achieved accuracy
is very similar for all three models, because the quality of the adjustment is independent of the values of the operational parameters or the liquid amount (see Fig. 23,
right bars).
0
0.1
0.2
0.3
0.4
0.5
0.6
0.7
0.8
0.9
1
1.1
1.2
1.3
1.4
1.5
1.6
1.7
Summed averaged deviation [-]
Model
A = 0.8 mm, f = 45.8 Hz, M = 0 %
A = 0.8 mm, f = 50.6 Hz, M = 0 %
A = 0.8 mm, f = 55.4 Hz, M = 0 %
A = 1.0 mm, f = 45.8 Hz, M = 0 %
A = 1.0 mm, f = 50.6 Hz, M = 0 %
A = 1.0 mm, f = 55.4 Hz, M = 0 %
A = 1.2 mm, f = 45.8 Hz, M = 0 %
A = 1.2 mm, f = 50.6 Hz, M = 0 %
A = 1.2 mm, f = 55.4 Hz, M = 0 %
A = 0.8 mm, f = 45.8 Hz, M = 2.5 %
A = 0.8 mm, f = 50.6 Hz, M = 2.5 %
A = 0.8 mm, f = 55.4 Hz, M = 2.5 %
A = 1.0 mm, f = 45.8 Hz, M = 2.5 %
A = 1.0 mm, f = 50.6 Hz, M = 2.5 %
A = 1.0 mm, f = 55.4 Hz, M = 2.5 %
A = 1.2 mm, f = 45.8 Hz, M = 2.5 %
A = 1.2 mm, f = 50.6 Hz, M = 2.5 %
A = 1.2 mm, f = 55.4 Hz, M = 2.5 %
A = 0.8 mm, f = 45.8 Hz, M = 5 %
A = 0.8 mm, f = 50.6 Hz, M = 5 %
A = 0.8 mm, f = 55.4 Hz, M = 5 %
A = 1.0 mm, f = 45.8 Hz, M = 5 %
A = 1.0 mm, f = 50.6 Hz, M = 5 %
A = 1.0 mm, f = 55.4 Hz, M = 5 %
A = 1.2 mm, f = 45.8 Hz, M = 5 %
A = 1.2 mm, f = 50.6 Hz, M = 5 %
A = 1.2 mm, f = 55.4 Hz, M = 5 %
a
b
c
Fig. 23 Deviations between the fraction retained per size class obtained by phenomenological
screening models as stated in Table 3 and discrete element simulations summed up for all investigated
simulations. The process models are adjusted to the simulation results by applying one set of
parameters for all simulations (bars on the left side of each model) and by applying one set of
parameters for each simulation, showing the best possible adjustment (bars on the right side of each
model). Reprint with permission from [123]
191
The process models are first adjusted to the simulation results applying one set
of parameters for all simulations which is presented in Fig. 23 (bars on the left side
of each model). The average deviations for the models are 0.0593 (model a), 0.0387
(model b) and 0.0417 (model c). The parameter sets for the three models are as
follows:
• No. 1: k = 1142.6444, α = −0.0193, γ = −161.2886
• No. 2: k s = 1.3883, α = 0.8288, γ = 2.2026, k p = 0.0542, β = −5.5913, δ =
0.4581
• No. 3: k s = 5.3935, α = −9.3318, γ = 9.6818, k p = 5.0896, β = 0.7160, δ =
2.4247
In addition, these results are compared to the best possible fit when one set of
parameters is used for each simulation (Fig. 23, bars on the right side of each model;
parameter sets not shown here). The best possible average deviations for the models
obtained are 0.0392 (model a/model b) and 0.0403 (model c). The achieved accuracy
is very similar for all three models, because the quality of the adjustment is independent of the values of the operational parameters or the liquid amount (see Fig. 23,
right bars).
0
0.1
0.2
0.3
0.4
0.5
0.6
0.7
0.8
0.9
1
1.1
1.2
1.3
1.4
1.5
1.6
1.7
Summed averaged deviation [-]
Model
A = 0.8 mm, f = 45.8 Hz, M = 0 %
A = 0.8 mm, f = 50.6 Hz, M = 0 %
A = 0.8 mm, f = 55.4 Hz, M = 0 %
A = 1.0 mm, f = 45.8 Hz, M = 0 %
A = 1.0 mm, f = 50.6 Hz, M = 0 %
A = 1.0 mm, f = 55.4 Hz, M = 0 %
A = 1.2 mm, f = 45.8 Hz, M = 0 %
A = 1.2 mm, f = 50.6 Hz, M = 0 %
A = 1.2 mm, f = 55.4 Hz, M = 0 %
A = 0.8 mm, f = 45.8 Hz, M = 2.5 %
A = 0.8 mm, f = 50.6 Hz, M = 2.5 %
A = 0.8 mm, f = 55.4 Hz, M = 2.5 %
A = 1.0 mm, f = 45.8 Hz, M = 2.5 %
A = 1.0 mm, f = 50.6 Hz, M = 2.5 %
A = 1.0 mm, f = 55.4 Hz, M = 2.5 %
A = 1.2 mm, f = 45.8 Hz, M = 2.5 %
A = 1.2 mm, f = 50.6 Hz, M = 2.5 %
A = 1.2 mm, f = 55.4 Hz, M = 2.5 %
A = 0.8 mm, f = 45.8 Hz, M = 5 %
A = 0.8 mm, f = 50.6 Hz, M = 5 %
A = 0.8 mm, f = 55.4 Hz, M = 5 %
A = 1.0 mm, f = 45.8 Hz, M = 5 %
A = 1.0 mm, f = 50.6 Hz, M = 5 %
A = 1.0 mm, f = 55.4 Hz, M = 5 %
A = 1.2 mm, f = 45.8 Hz, M = 5 %
A = 1.2 mm, f = 50.6 Hz, M = 5 %
A = 1.2 mm, f = 55.4 Hz, M = 5 %
a
b
c
Fig. 23 Deviations between the fraction retained per size class obtained by phenomenological
screening models as stated in Table 3 and discrete element simulations summed up for all investigated
simulations. The process models are adjusted to the simulation results by applying one set of
parameters for all simulations (bars on the left side of each model) and by applying one set of
parameters for each simulation, showing the best possible adjustment (bars on the right side of each
model). Reprint with permission from [123]