

5 Development of a Dynamic-Physical Process Model for Sieving
183
a
b
c
d
e
f
0
0.5
1
1.5
2
Summed averaged deviation [kg]
Model
Stroke angle 30°/150°
Stroke angle 45°/135°
Stroke angle 60°/120°
Stroke angle 90°
α β γ δ ε ζ η θ κ λ μ ν ξ π ρ
0
0.5
1
1.5
2
Model
Summed averaged deviation [kg]
α β γ δ ε ζ η θ κ λ μ ν ξ π ρ
0
0.5
1
1.5
2
Model
Summed averaged deviation [kg]
α β γ δ ε ζ η θ κ λ μ ν ξ π ρ
0
0.5
1
1.5
2
Summed averaged deviation [kg]
Model
Mass 1 kg
Mass 2 kg
Mass 3 kg
Mass 4 kg
Mass 5 kg
Mass 6 kg
α β γ δ ε ζ η θ κ λ μ ν ξ π ρ
0
0.5
1
1.5
2
Model
Summed averaged deviation [kg]
α β γ δ ε ζ η θ κ λ μ ν ξ π ρ
0
0.5
1
1.5
2
Model
Summed averaged deviation [kg]
α β γ δ ε ζ η θ κ λ μ ν ξ π ρ
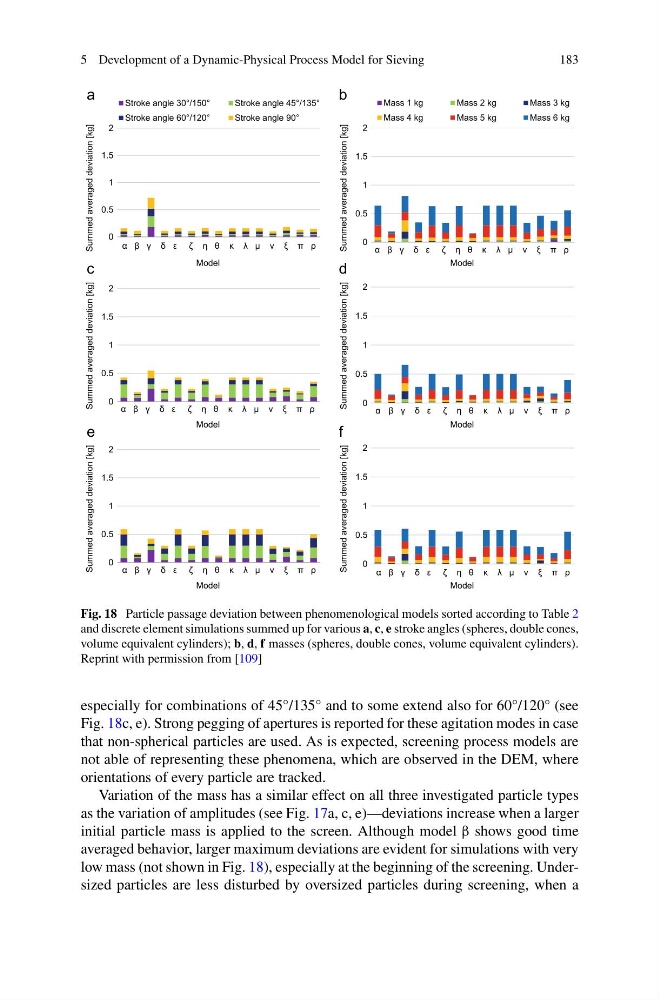
Fig. 18 Particle passage deviation between phenomenological models sorted according to Table 2
and discrete element simulations summed up for various a, c, e stroke angles (spheres, double cones,
volume equivalent cylinders); b, d, f masses (spheres, double cones, volume equivalent cylinders).
Reprint with permission from [109]
especially for combinations of 45°/135° and to some extend also for 60°/120° (see
Fig. 18c, e). Strong pegging of apertures is reported for these agitation modes in case
that non-spherical particles are used. As is expected, screening process models are
not able of representing these phenomena, which are observed in the DEM, where
orientations of every particle are tracked.
Variation of the mass has a similar effect on all three investigated particle types
as the variation of amplitudes (see Fig. 17a, c, e)—deviations increase when a larger
initial particle mass is applied to the screen. Although model β shows good time
averaged behavior, larger maximum deviations are evident for simulations with very
low mass (not shown in Fig. 18), especially at the beginning of the screening. Undersized particles are less disturbed by oversized particles during screening, when a
183
a
b
c
d
e
f
0
0.5
1
1.5
2
Summed averaged deviation [kg]
Model
Stroke angle 30°/150°
Stroke angle 45°/135°
Stroke angle 60°/120°
Stroke angle 90°
α β γ δ ε ζ η θ κ λ μ ν ξ π ρ
0
0.5
1
1.5
2
Model
Summed averaged deviation [kg]
α β γ δ ε ζ η θ κ λ μ ν ξ π ρ
0
0.5
1
1.5
2
Model
Summed averaged deviation [kg]
α β γ δ ε ζ η θ κ λ μ ν ξ π ρ
0
0.5
1
1.5
2
Summed averaged deviation [kg]
Model
Mass 1 kg
Mass 2 kg
Mass 3 kg
Mass 4 kg
Mass 5 kg
Mass 6 kg
α β γ δ ε ζ η θ κ λ μ ν ξ π ρ
0
0.5
1
1.5
2
Model
Summed averaged deviation [kg]
α β γ δ ε ζ η θ κ λ μ ν ξ π ρ
0
0.5
1
1.5
2
Model
Summed averaged deviation [kg]
α β γ δ ε ζ η θ κ λ μ ν ξ π ρ
Fig. 18 Particle passage deviation between phenomenological models sorted according to Table 2
and discrete element simulations summed up for various a, c, e stroke angles (spheres, double cones,
volume equivalent cylinders); b, d, f masses (spheres, double cones, volume equivalent cylinders).
Reprint with permission from [109]
especially for combinations of 45°/135° and to some extend also for 60°/120° (see
Fig. 18c, e). Strong pegging of apertures is reported for these agitation modes in case
that non-spherical particles are used. As is expected, screening process models are
not able of representing these phenomena, which are observed in the DEM, where
orientations of every particle are tracked.
Variation of the mass has a similar effect on all three investigated particle types
as the variation of amplitudes (see Fig. 17a, c, e)—deviations increase when a larger
initial particle mass is applied to the screen. Although model β shows good time
averaged behavior, larger maximum deviations are evident for simulations with very
low mass (not shown in Fig. 18), especially at the beginning of the screening. Undersized particles are less disturbed by oversized particles during screening, when a