

174
D. Markauskas and H. Kruggel-Emden
0
0.2
0.4
0.6
0.8
1
1.2
1.4
1
2
3
4
5
6
7
8
9
1 0
1 1
1 2
1 3
Summed averaged deviation [-]
Model
Initial case
Amplitude 1.32 mm
Amplitude 2.2 mm
Amplitude 2.64 mm
Frequency 20.7 Hz
Frequency 34.5 Hz
Frequency 41.4 Hz
Mass flow 50 g/s
Mass flow 150 g/s
Mass flow 200 g/s
0
0.2
0.4
0.6
0.8
1
1.2
1.4
1
2
3
4
5
6
7
8
9
1 0
1 1
1 2
1 3
Summed averaged deviation [-]
Model
0
0.2
0.4
0.6
0.8
1
1.2
1.4
1
2
3
4
5
6
7
8
9
1 0
1 1
1 2
1 3
Summed averaged deviation [-]
Model
a
b
c
Stroke angle 30°
Stroke angle 60°
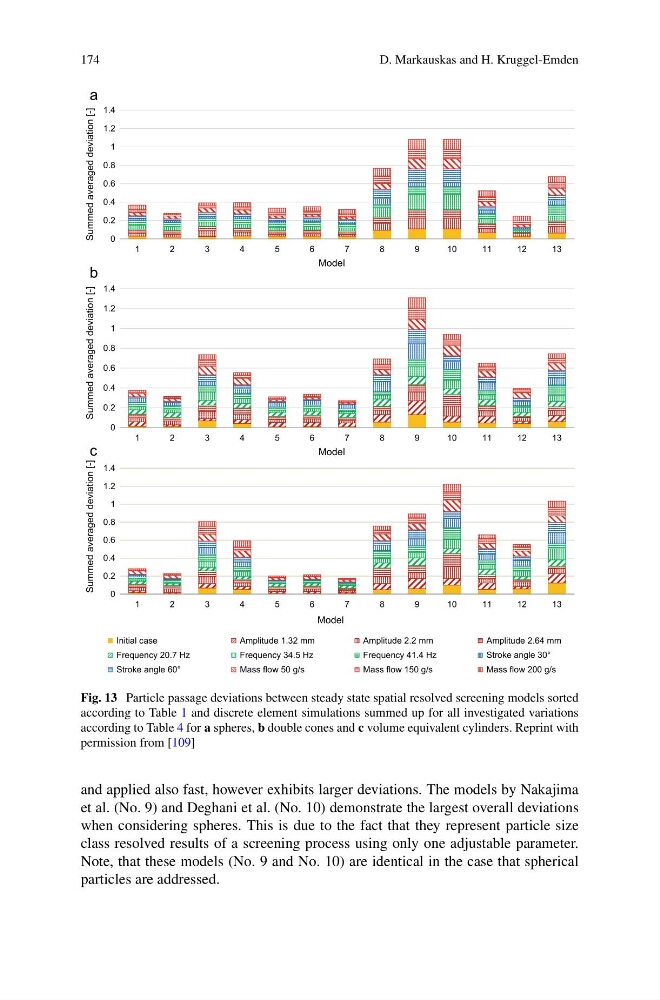
Fig. 13 Particle passage deviations between steady state spatial resolved screening models sorted
according to Table 1 and discrete element simulations summed up for all investigated variations
according to Table 4 for a spheres, b double cones and c volume equivalent cylinders. Reprint with
permission from [109]
and applied also fast, however exhibits larger deviations. The models by Nakajima
et al. (No. 9) and Deghani et al. (No. 10) demonstrate the largest overall deviations
when considering spheres. This is due to the fact that they represent particle size
class resolved results of a screening process using only one adjustable parameter.
Note, that these models (No. 9 and No. 10) are identical in the case that spherical
particles are addressed.
D. Markauskas and H. Kruggel-Emden
0
0.2
0.4
0.6
0.8
1
1.2
1.4
1
2
3
4
5
6
7
8
9
1 0
1 1
1 2
1 3
Summed averaged deviation [-]
Model
Initial case
Amplitude 1.32 mm
Amplitude 2.2 mm
Amplitude 2.64 mm
Frequency 20.7 Hz
Frequency 34.5 Hz
Frequency 41.4 Hz
Mass flow 50 g/s
Mass flow 150 g/s
Mass flow 200 g/s
0
0.2
0.4
0.6
0.8
1
1.2
1.4
1
2
3
4
5
6
7
8
9
1 0
1 1
1 2
1 3
Summed averaged deviation [-]
Model
0
0.2
0.4
0.6
0.8
1
1.2
1.4
1
2
3
4
5
6
7
8
9
1 0
1 1
1 2
1 3
Summed averaged deviation [-]
Model
a
b
c
Stroke angle 30°
Stroke angle 60°
Fig. 13 Particle passage deviations between steady state spatial resolved screening models sorted
according to Table 1 and discrete element simulations summed up for all investigated variations
according to Table 4 for a spheres, b double cones and c volume equivalent cylinders. Reprint with
permission from [109]
and applied also fast, however exhibits larger deviations. The models by Nakajima
et al. (No. 9) and Deghani et al. (No. 10) demonstrate the largest overall deviations
when considering spheres. This is due to the fact that they represent particle size
class resolved results of a screening process using only one adjustable parameter.
Note, that these models (No. 9 and No. 10) are identical in the case that spherical
particles are addressed.