

5 Development of a Dynamic-Physical Process Model for Sieving
171
0
0.05
0.1
0.15
0.2
0.25
I
II
III
IV
V
VI
VII
Summed averaged deviation [-]
Model
Initial case
Amplitude 1.32 mm
Amplitude 2.2 mm
Amplitude 2.64 mm
Frequency 20.7 Hz
Frequency 34.5 Hz
Frequency 41.4 Hz
Mass flow 50 g/s
Mass flow 150 g/s
Mass flow 200 g/s
c
0
0.05
0.1
0.15
0.2
0.25
0.3
I
II
III
IV
V
VI
VII
Summed averaged deviation [-]
Model
b
0
0.05
0.1
0.15
0.2
0.25
I
II
III
IV
V
VI
VII
Summed averaged deviation [-]
Model
a
Stroke angle 30°
Stroke angle 60°
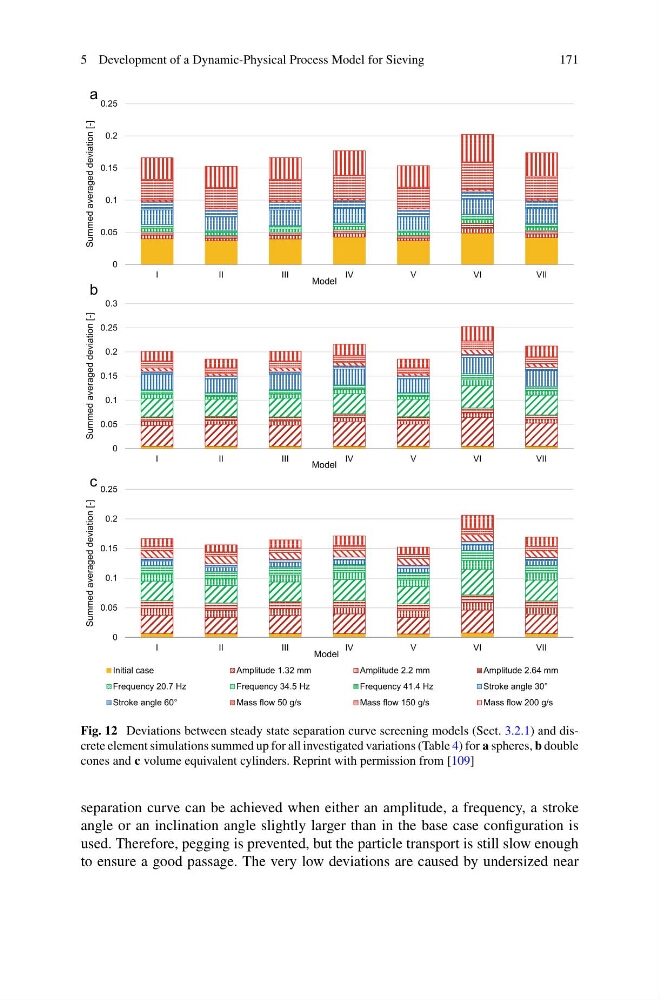
Fig. 12 Deviations between steady state separation curve screening models (Sect. 3.2.1) and discrete element simulations summed up for all investigated variations (Table 4) for a spheres, b double
cones and c volume equivalent cylinders. Reprint with permission from [109]
separation curve can be achieved when either an amplitude, a frequency, a stroke
angle or an inclination angle slightly larger than in the base case configuration is
used. Therefore, pegging is prevented, but the particle transport is still slow enough
to ensure a good passage. The very low deviations are caused by undersized near
171
0
0.05
0.1
0.15
0.2
0.25
I
II
III
IV
V
VI
VII
Summed averaged deviation [-]
Model
Initial case
Amplitude 1.32 mm
Amplitude 2.2 mm
Amplitude 2.64 mm
Frequency 20.7 Hz
Frequency 34.5 Hz
Frequency 41.4 Hz
Mass flow 50 g/s
Mass flow 150 g/s
Mass flow 200 g/s
c
0
0.05
0.1
0.15
0.2
0.25
0.3
I
II
III
IV
V
VI
VII
Summed averaged deviation [-]
Model
b
0
0.05
0.1
0.15
0.2
0.25
I
II
III
IV
V
VI
VII
Summed averaged deviation [-]
Model
a
Stroke angle 30°
Stroke angle 60°
Fig. 12 Deviations between steady state separation curve screening models (Sect. 3.2.1) and discrete element simulations summed up for all investigated variations (Table 4) for a spheres, b double
cones and c volume equivalent cylinders. Reprint with permission from [109]
separation curve can be achieved when either an amplitude, a frequency, a stroke
angle or an inclination angle slightly larger than in the base case configuration is
used. Therefore, pegging is prevented, but the particle transport is still slow enough
to ensure a good passage. The very low deviations are caused by undersized near