

134
H. Rehage and M. Kind
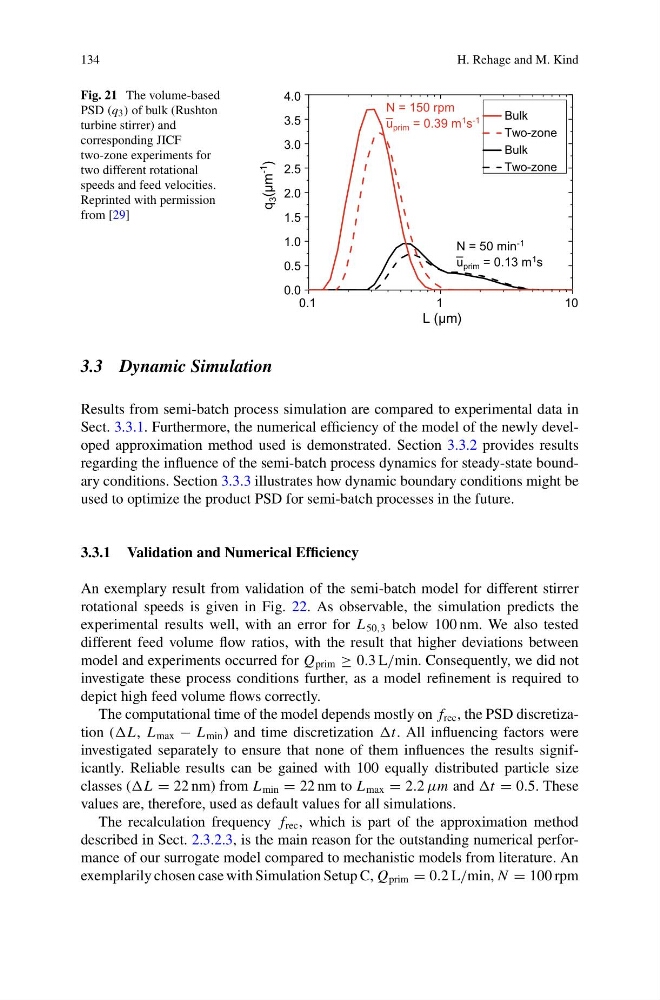
Fig. 21 The volume-based
PSD (q 3 ) of bulk (Rushton
turbine stirrer) and
corresponding JICF
two-zone experiments for
two different rotational
speeds and feed velocities.
Reprinted with permission
from [29]
0.1
1
10
0.0
0.5
1.0
1.5
2.0
2.5
3.0
3.5
4.0
N = 50 min
-1
u prim = 0.13 m 1 s
N = 150 rpm
u prim = 0.39 m 1 s -1
q
3 (µm
-1
)
L (µm)
Bulk
Two-zone
Bulk
Two-zone
3.3 Dynamic Simulation
Results from semi-batch process simulation are compared to experimental data in
Sect. 3.3.1. Furthermore, the numerical efficiency of the model of the newly developed approximation method used is demonstrated. Section 3.3.2 provides results
regarding the influence of the semi-batch process dynamics for steady-state boundary conditions. Section 3.3.3 illustrates how dynamic boundary conditions might be
used to optimize the product PSD for semi-batch processes in the future.
3.3.1 Validation and Numerical Efficiency
An exemplary result from validation of the semi-batch model for different stirrer
rotational speeds is given in Fig. 22. As observable, the simulation predicts the
experimental results well, with an error for L 50,3 below 100 nm. We also tested
different feed volume flow ratios, with the result that higher deviations between
model and experiments occurred for Q prim ≥ 0.3 L/min. Consequently, we did not
investigate these process conditions further, as a model refinement is required to
depict high feed volume flows correctly.
The computational time of the model depends mostly on f rec , the PSD discretization ( L max − L min ) and time discretization All influencing factors were
investigated separately to ensure that none of them influences the results significantly. Reliable results can be gained with 100 equally distributed particle size
classes ( = 22 nm) from L min = 22 nm to L max = 2.2 μm and = 0.5. These
values are, therefore, used as default values for all simulations.
The recalculation frequency f rec , which is part of the approximation method
described in Sect. 2.3.2.3, is the main reason for the outstanding numerical performance of our surrogate model compared to mechanistic models from literature. An
exemplarily chosen case with Simulation Setup C, Q prim = 0.2 L/min, N = 100 rpm
H. Rehage and M. Kind
Fig. 21 The volume-based
PSD (q 3 ) of bulk (Rushton
turbine stirrer) and
corresponding JICF
two-zone experiments for
two different rotational
speeds and feed velocities.
Reprinted with permission
from [29]
0.1
1
10
0.0
0.5
1.0
1.5
2.0
2.5
3.0
3.5
4.0
N = 50 min
-1
u prim = 0.13 m 1 s
N = 150 rpm
u prim = 0.39 m 1 s -1
q
3 (µm
-1
)
L (µm)
Bulk
Two-zone
Bulk
Two-zone
3.3 Dynamic Simulation
Results from semi-batch process simulation are compared to experimental data in
Sect. 3.3.1. Furthermore, the numerical efficiency of the model of the newly developed approximation method used is demonstrated. Section 3.3.2 provides results
regarding the influence of the semi-batch process dynamics for steady-state boundary conditions. Section 3.3.3 illustrates how dynamic boundary conditions might be
used to optimize the product PSD for semi-batch processes in the future.
3.3.1 Validation and Numerical Efficiency
An exemplary result from validation of the semi-batch model for different stirrer
rotational speeds is given in Fig. 22. As observable, the simulation predicts the
experimental results well, with an error for L 50,3 below 100 nm. We also tested
different feed volume flow ratios, with the result that higher deviations between
model and experiments occurred for Q prim ≥ 0.3 L/min. Consequently, we did not
investigate these process conditions further, as a model refinement is required to
depict high feed volume flows correctly.
The computational time of the model depends mostly on f rec , the PSD discretization ( L max − L min ) and time discretization All influencing factors were
investigated separately to ensure that none of them influences the results significantly. Reliable results can be gained with 100 equally distributed particle size
classes ( = 22 nm) from L min = 22 nm to L max = 2.2 μm and = 0.5. These
values are, therefore, used as default values for all simulations.
The recalculation frequency f rec , which is part of the approximation method
described in Sect. 2.3.2.3, is the main reason for the outstanding numerical performance of our surrogate model compared to mechanistic models from literature. An
exemplarily chosen case with Simulation Setup C, Q prim = 0.2 L/min, N = 100 rpm