

102
C. Neugebauer et al.
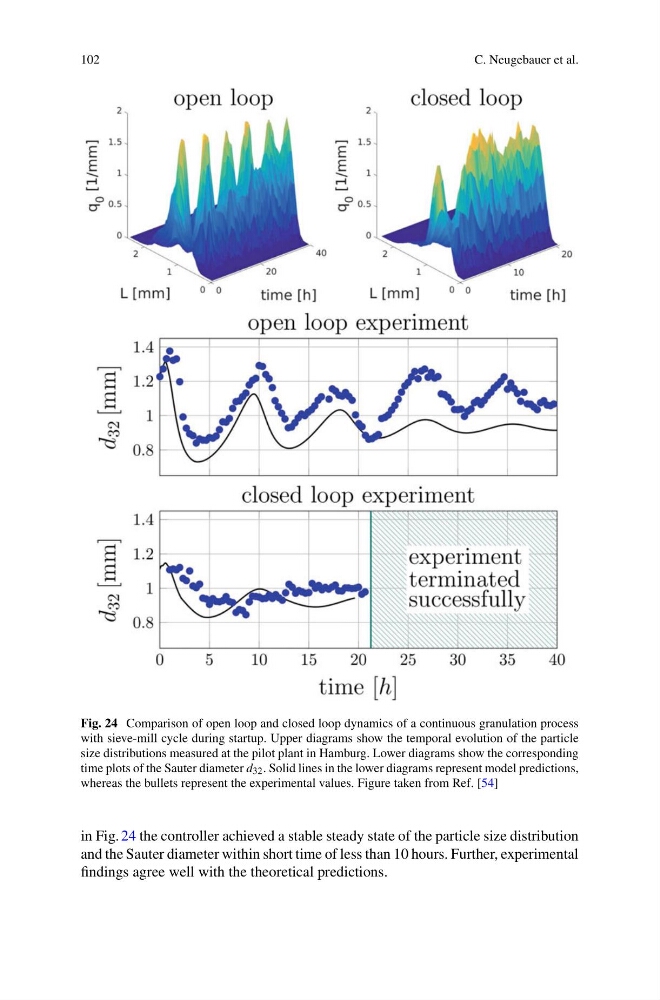
Fig. 24 Comparison of open loop and closed loop dynamics of a continuous granulation process
with sieve-mill cycle during startup. Upper diagrams show the temporal evolution of the particle
size distributions measured at the pilot plant in Hamburg. Lower diagrams show the corresponding
time plots of the Sauter diameter d 32 . Solid lines in the lower diagrams represent model predictions,
whereas the bullets represent the experimental values. Figure taken from Ref. [54]
in Fig. 24 the controller achieved a stable steady state of the particle size distribution
and the Sauter diameter within short time of less than 10 hours. Further, experimental
findings agree well with the theoretical predictions.
C. Neugebauer et al.
Fig. 24 Comparison of open loop and closed loop dynamics of a continuous granulation process
with sieve-mill cycle during startup. Upper diagrams show the temporal evolution of the particle
size distributions measured at the pilot plant in Hamburg. Lower diagrams show the corresponding
time plots of the Sauter diameter d 32 . Solid lines in the lower diagrams represent model predictions,
whereas the bullets represent the experimental values. Figure taken from Ref. [54]
in Fig. 24 the controller achieved a stable steady state of the particle size distribution
and the Sauter diameter within short time of less than 10 hours. Further, experimental
findings agree well with the theoretical predictions.