

286
7 Forced Vibration Analysis of Multiple Degrees of Freedom System
7.7 Earthquake Spectrum Analysis of Structures Having
MDF System
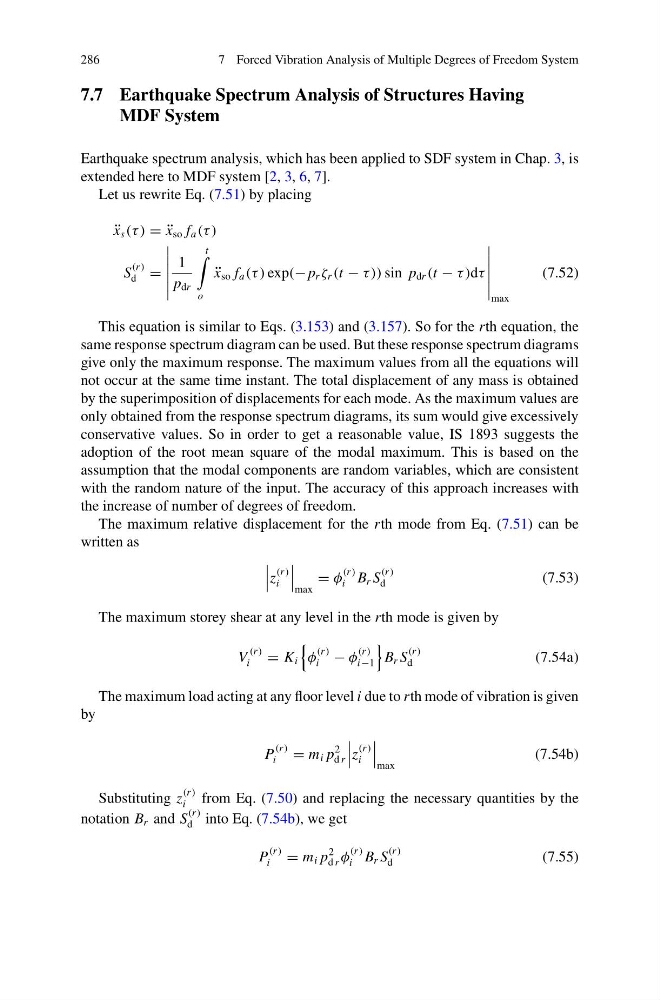
Earthquake spectrum analysis, which has been applied to SDF system in Chap. 3, is
extended here to MDF system [2, 3, 6, 7].
Let us rewrite Eq. (7.51) by placing
¨
x s (τ ) = ¨
x so f a (τ )
S
(r )
d =
1
p dr
t
o
¨
x so f a (τ ) exp(− p r ζ r (t − τ )) sin p dr (t − τ )dτ
max
(7.52)
This equation is similar to Eqs. (3.153) and (3.157). So for the rth equation, the
same response spectrum diagram can be used. But these response spectrum diagrams
give only the maximum response. The maximum values from all the equations will
not occur at the same time instant. The total displacement of any mass is obtained
by the superimposition of displacements for each mode. As the maximum values are
only obtained from the response spectrum diagrams, its sum would give excessively
conservative values. So in order to get a reasonable value, IS 1893 suggests the
adoption of the root mean square of the modal maximum. This is based on the
assumption that the modal components are random variables, which are consistent
with the random nature of the input. The accuracy of this approach increases with
the increase of number of degrees of freedom.
The maximum relative displacement for the rth mode from Eq. (7.51) can be
written as
z
(r )
i
max
= φ
(r )
i B r S
(r )
d
(7.53)
The maximum storey shear at any level in the rth mode is given by
V
(r )
i
= K i
φ
(r )
i − φ
(r )
i−1
B r S
(r )
d
(7.54a)
The maximum load acting at any floor level i due to rth mode of vibration is given
by
P
(r )
i
= m i p
2
d r
z
(r )
i
max
(7.54b)
Substituting z
(r )
i
from Eq. (7.50) and replacing the necessary quantities by the
notation B r and S
(r )
d into Eq. (7.54b), we get
P
(r )
i
= m i p
2
d r φ
(r )
i B r S
(r )
d
(7.55)
7 Forced Vibration Analysis of Multiple Degrees of Freedom System
7.7 Earthquake Spectrum Analysis of Structures Having
MDF System
Earthquake spectrum analysis, which has been applied to SDF system in Chap. 3, is
extended here to MDF system [2, 3, 6, 7].
Let us rewrite Eq. (7.51) by placing
¨
x s (τ ) = ¨
x so f a (τ )
S
(r )
d =
1
p dr
t
o
¨
x so f a (τ ) exp(− p r ζ r (t − τ )) sin p dr (t − τ )dτ
max
(7.52)
This equation is similar to Eqs. (3.153) and (3.157). So for the rth equation, the
same response spectrum diagram can be used. But these response spectrum diagrams
give only the maximum response. The maximum values from all the equations will
not occur at the same time instant. The total displacement of any mass is obtained
by the superimposition of displacements for each mode. As the maximum values are
only obtained from the response spectrum diagrams, its sum would give excessively
conservative values. So in order to get a reasonable value, IS 1893 suggests the
adoption of the root mean square of the modal maximum. This is based on the
assumption that the modal components are random variables, which are consistent
with the random nature of the input. The accuracy of this approach increases with
the increase of number of degrees of freedom.
The maximum relative displacement for the rth mode from Eq. (7.51) can be
written as
z
(r )
i
max
= φ
(r )
i B r S
(r )
d
(7.53)
The maximum storey shear at any level in the rth mode is given by
V
(r )
i
= K i
φ
(r )
i − φ
(r )
i−1
B r S
(r )
d
(7.54a)
The maximum load acting at any floor level i due to rth mode of vibration is given
by
P
(r )
i
= m i p
2
d r
z
(r )
i
max
(7.54b)
Substituting z
(r )
i
from Eq. (7.50) and replacing the necessary quantities by the
notation B r and S
(r )
d into Eq. (7.54b), we get
P
(r )
i
= m i p
2
d r φ
(r )
i B r S
(r )
d
(7.55)