

of plots “per Experiment” to get a plot window for each experiment (Fig. 6), where
we can see the experimental data (symbols) and the simulation with the optimized
parameter values (solid lines). These optimized values can be seen by clicking Result
(below Parameter Estimation) on the left panel (Fig. 7). Click on the Update Model
button to set the optimized values as the current parameter values (and as Initial
values for further Parameter Estimation runs).
As commented below, it is better to start adjusting initially the minimum possible
number of equations and add later second-order effect equations.
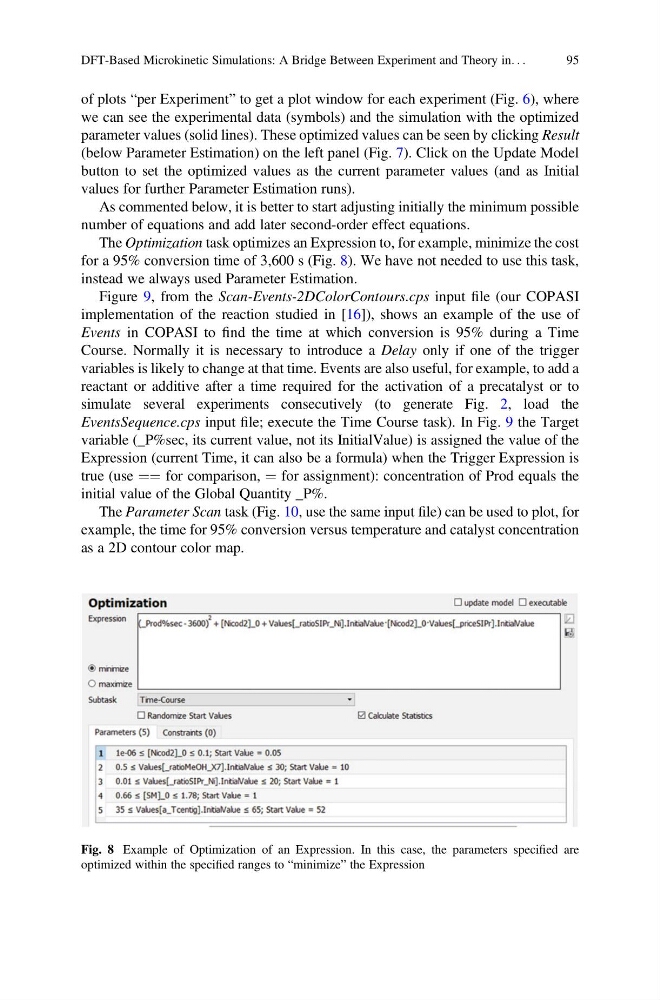
The Optimization task optimizes an Expression to, for example, minimize the cost
for a 95% conversion time of 3,600 s (Fig. 8). We have not needed to use this task,
instead we always used Parameter Estimation.
Figure 9, from the Scan-Events-2DColorContours.cps input file (our COPASI
implementation of the reaction studied in [16]), shows an example of the use of
Events in COPASI to find the time at which conversion is 95% during a Time
Course. Normally it is necessary to introduce a Delay only if one of the trigger
variables is likely to change at that time. Events are also useful, for example, to add a
reactant or additive after a time required for the activation of a precatalyst or to
simulate several experiments consecutively (to generate Fig. 2, load the
EventsSequence.cps input file; execute the Time Course task). In Fig. 9 the Target
variable (_P%sec, its current value, not its InitialValue) is assigned the value of the
Expression (current Time, it can also be a formula) when the Trigger Expression is
true (use ¼¼ for comparison, ¼ for assignment): concentration of Prod equals the
initial value of the Global Quantity _P%.
The Parameter Scan task (Fig. 10, use the same input file) can be used to plot, for
example, the time for 95% conversion versus temperature and catalyst concentration
as a 2D contour color map.
Fig. 8 Example of Optimization of an Expression. In this case, the parameters specified are
optimized within the specified ranges to “minimize” the Expression
DFT-Based Microkinetic Simulations: A Bridge Between Experiment and Theory in. . .
95
we can see the experimental data (symbols) and the simulation with the optimized
parameter values (solid lines). These optimized values can be seen by clicking Result
(below Parameter Estimation) on the left panel (Fig. 7). Click on the Update Model
button to set the optimized values as the current parameter values (and as Initial
values for further Parameter Estimation runs).
As commented below, it is better to start adjusting initially the minimum possible
number of equations and add later second-order effect equations.
The Optimization task optimizes an Expression to, for example, minimize the cost
for a 95% conversion time of 3,600 s (Fig. 8). We have not needed to use this task,
instead we always used Parameter Estimation.
Figure 9, from the Scan-Events-2DColorContours.cps input file (our COPASI
implementation of the reaction studied in [16]), shows an example of the use of
Events in COPASI to find the time at which conversion is 95% during a Time
Course. Normally it is necessary to introduce a Delay only if one of the trigger
variables is likely to change at that time. Events are also useful, for example, to add a
reactant or additive after a time required for the activation of a precatalyst or to
simulate several experiments consecutively (to generate Fig. 2, load the
EventsSequence.cps input file; execute the Time Course task). In Fig. 9 the Target
variable (_P%sec, its current value, not its InitialValue) is assigned the value of the
Expression (current Time, it can also be a formula) when the Trigger Expression is
true (use ¼¼ for comparison, ¼ for assignment): concentration of Prod equals the
initial value of the Global Quantity _P%.
The Parameter Scan task (Fig. 10, use the same input file) can be used to plot, for
example, the time for 95% conversion versus temperature and catalyst concentration
as a 2D contour color map.
Fig. 8 Example of Optimization of an Expression. In this case, the parameters specified are
optimized within the specified ranges to “minimize” the Expression
DFT-Based Microkinetic Simulations: A Bridge Between Experiment and Theory in. . .
95