

36
2 Experimental Methods for Determination of Nucleation Rates
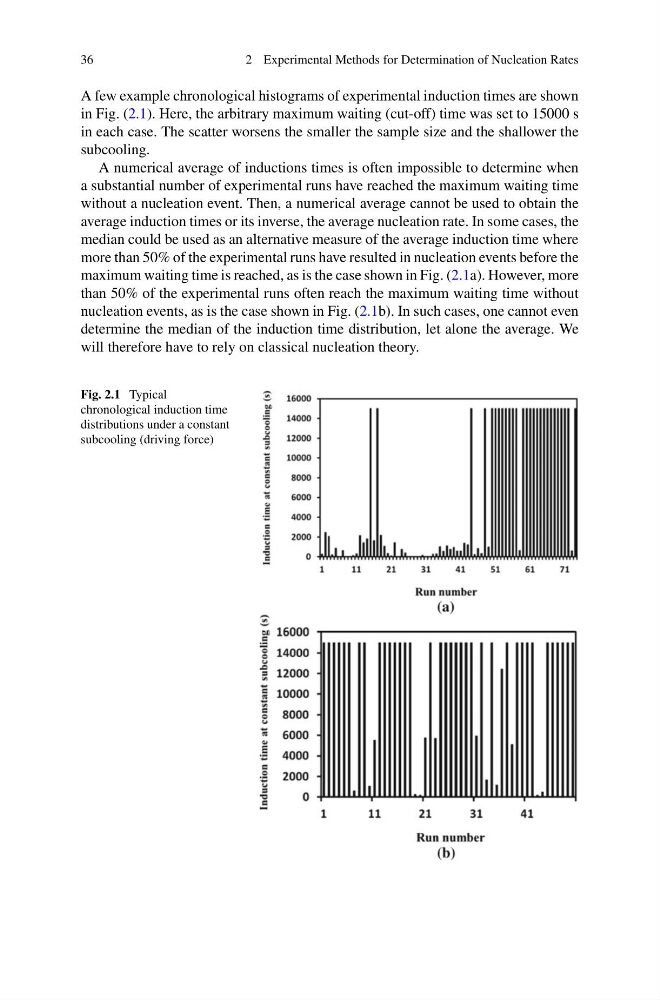
A few example chronological histograms of experimental induction times are shown
in Fig. (2.1). Here, the arbitrary maximum waiting (cut-off) time was set to 15000 s
in each case. The scatter worsens the smaller the sample size and the shallower the
subcooling.
A numerical average of inductions times is often impossible to determine when
a substantial number of experimental runs have reached the maximum waiting time
without a nucleation event. Then, a numerical average cannot be used to obtain the
average induction times or its inverse, the average nucleation rate. In some cases, the
median could be used as an alternative measure of the average induction time where
more than 50% of the experimental runs have resulted in nucleation events before the
maximum waiting time is reached, as is the case shown in Fig. (2.1a). However, more
than 50% of the experimental runs often reach the maximum waiting time without
nucleation events, as is the case shown in Fig. (2.1b). In such cases, one cannot even
determine the median of the induction time distribution, let alone the average. We
will therefore have to rely on classical nucleation theory.
Fig. 2.1 Typical
chronological induction time
distributions under a constant
subcooling (driving force)
2 Experimental Methods for Determination of Nucleation Rates
A few example chronological histograms of experimental induction times are shown
in Fig. (2.1). Here, the arbitrary maximum waiting (cut-off) time was set to 15000 s
in each case. The scatter worsens the smaller the sample size and the shallower the
subcooling.
A numerical average of inductions times is often impossible to determine when
a substantial number of experimental runs have reached the maximum waiting time
without a nucleation event. Then, a numerical average cannot be used to obtain the
average induction times or its inverse, the average nucleation rate. In some cases, the
median could be used as an alternative measure of the average induction time where
more than 50% of the experimental runs have resulted in nucleation events before the
maximum waiting time is reached, as is the case shown in Fig. (2.1a). However, more
than 50% of the experimental runs often reach the maximum waiting time without
nucleation events, as is the case shown in Fig. (2.1b). In such cases, one cannot even
determine the median of the induction time distribution, let alone the average. We
will therefore have to rely on classical nucleation theory.
Fig. 2.1 Typical
chronological induction time
distributions under a constant
subcooling (driving force)