

10
1 Nucleation Theory
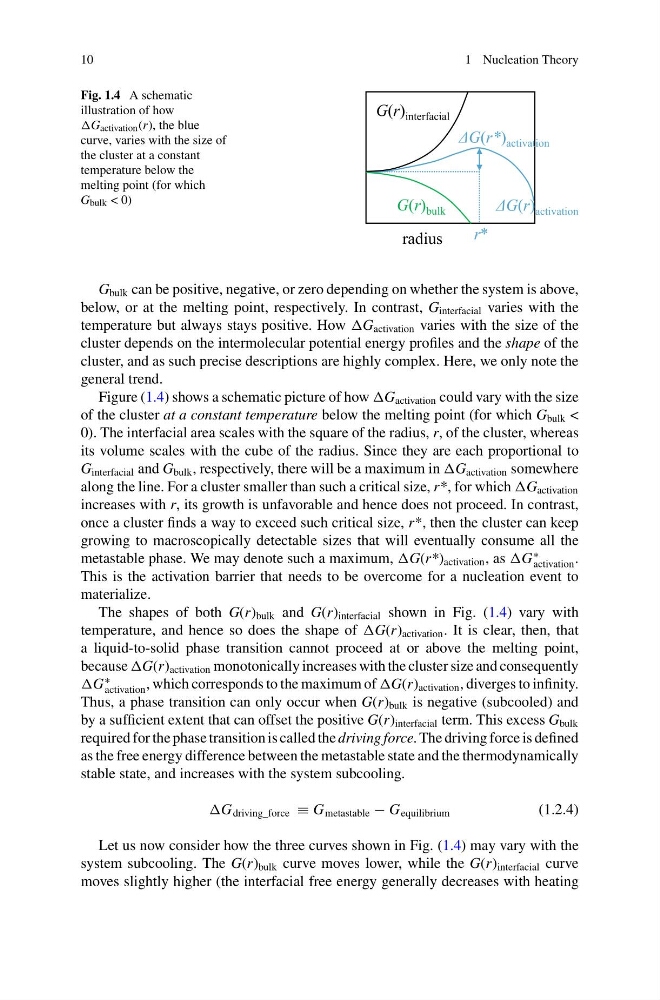
Fig. 1.4 A schematic
illustration of how
activation (r), the blue
curve, varies with the size of
the cluster at a constant
temperature below the
melting point (for which
G bulk < 0)
radius
G(r) bulk
G(r) interfacial
ΔG(r*) activation
r*
ΔG(r) activation
G bulk can be positive, negative, or zero depending on whether the system is above,
below, or at the melting point, respectively. In contrast, G interfacial varies with the
temperature but always stays positive. How activation varies with the size of the
cluster depends on the intermolecular potential energy profiles and the shape of the
cluster, and as such precise descriptions are highly complex. Here, we only note the
general trend.
Figure (1.4) shows a schematic picture of how activation could vary with the size
of the cluster at a constant temperature below the melting point (for which G bulk <
0). The interfacial area scales with the square of the radius, r, of the cluster, whereas
its volume scales with the cube of the radius. Since they are each proportional to
G interfacial and G bulk , respectively, there will be a maximum in activation somewhere
along the line. For a cluster smaller than such a critical size, r*, for which activation
increases with r, its growth is unfavorable and hence does not proceed. In contrast,
once a cluster finds a way to exceed such critical size, r*, then the cluster can keep
growing to macroscopically detectable sizes that will eventually consume all the
metastable phase. We may denote such a maximum, activation , as
∗
activation .
This is the activation barrier that needs to be overcome for a nucleation event to
materialize.
The shapes of both G(r) bulk and G(r) interfacial shown in Fig. (1.4) vary with
temperature, and hence so does the shape of activation . It is clear, then, that
a liquid-to-solid phase transition cannot proceed at or above the melting point,
because activation monotonically increases with the cluster size and consequently
∗
activation , which corresponds to the maximum of activation , diverges to infinity.
Thus, a phase transition can only occur when G(r) bulk is negative (subcooled) and
by a sufficient extent that can offset the positive G(r) interfacial term. This excess G bulk
required for the phase transition is called the driving force. The driving force is defined
as the free energy difference between the metastable state and the thermodynamically
stable state, and increases with the system subcooling.
driving_force ≡ G metastable − G equilibrium
(1.2.4)
Let us now consider how the three curves shown in Fig. (1.4) may vary with the
system subcooling. The G(r) bulk curve moves lower, while the G(r) interfacial curve
moves slightly higher (the interfacial free energy generally decreases with heating
1 Nucleation Theory
Fig. 1.4 A schematic
illustration of how
activation (r), the blue
curve, varies with the size of
the cluster at a constant
temperature below the
melting point (for which
G bulk < 0)
radius
G(r) bulk
G(r) interfacial
ΔG(r*) activation
r*
ΔG(r) activation
G bulk can be positive, negative, or zero depending on whether the system is above,
below, or at the melting point, respectively. In contrast, G interfacial varies with the
temperature but always stays positive. How activation varies with the size of the
cluster depends on the intermolecular potential energy profiles and the shape of the
cluster, and as such precise descriptions are highly complex. Here, we only note the
general trend.
Figure (1.4) shows a schematic picture of how activation could vary with the size
of the cluster at a constant temperature below the melting point (for which G bulk <
0). The interfacial area scales with the square of the radius, r, of the cluster, whereas
its volume scales with the cube of the radius. Since they are each proportional to
G interfacial and G bulk , respectively, there will be a maximum in activation somewhere
along the line. For a cluster smaller than such a critical size, r*, for which activation
increases with r, its growth is unfavorable and hence does not proceed. In contrast,
once a cluster finds a way to exceed such critical size, r*, then the cluster can keep
growing to macroscopically detectable sizes that will eventually consume all the
metastable phase. We may denote such a maximum, activation , as
∗
activation .
This is the activation barrier that needs to be overcome for a nucleation event to
materialize.
The shapes of both G(r) bulk and G(r) interfacial shown in Fig. (1.4) vary with
temperature, and hence so does the shape of activation . It is clear, then, that
a liquid-to-solid phase transition cannot proceed at or above the melting point,
because activation monotonically increases with the cluster size and consequently
∗
activation , which corresponds to the maximum of activation , diverges to infinity.
Thus, a phase transition can only occur when G(r) bulk is negative (subcooled) and
by a sufficient extent that can offset the positive G(r) interfacial term. This excess G bulk
required for the phase transition is called the driving force. The driving force is defined
as the free energy difference between the metastable state and the thermodynamically
stable state, and increases with the system subcooling.
driving_force ≡ G metastable − G equilibrium
(1.2.4)
Let us now consider how the three curves shown in Fig. (1.4) may vary with the
system subcooling. The G(r) bulk curve moves lower, while the G(r) interfacial curve
moves slightly higher (the interfacial free energy generally decreases with heating