

380
C. Mani et al.
0
0.1
0.2
0.3
0.4
0.5
0.6
0.7
0.8
0.9
1
Cyclic ratio (n/N
f
)
0
0.1
0.2
0.3
0.4
0.5
0.6
0.7
0.8
0.9
1
Cumulative fatigue Damage (D)
Fig. 11.9 Fatigue damage test result of welded specimen
Hence, in this scenario, it is recommended to examine the fracture surface using
SEM to identify fracture surface. VEGA 3 series PC-controlled scanning electron
microscopes with a tungsten heated filament was deployed to examine the fracture
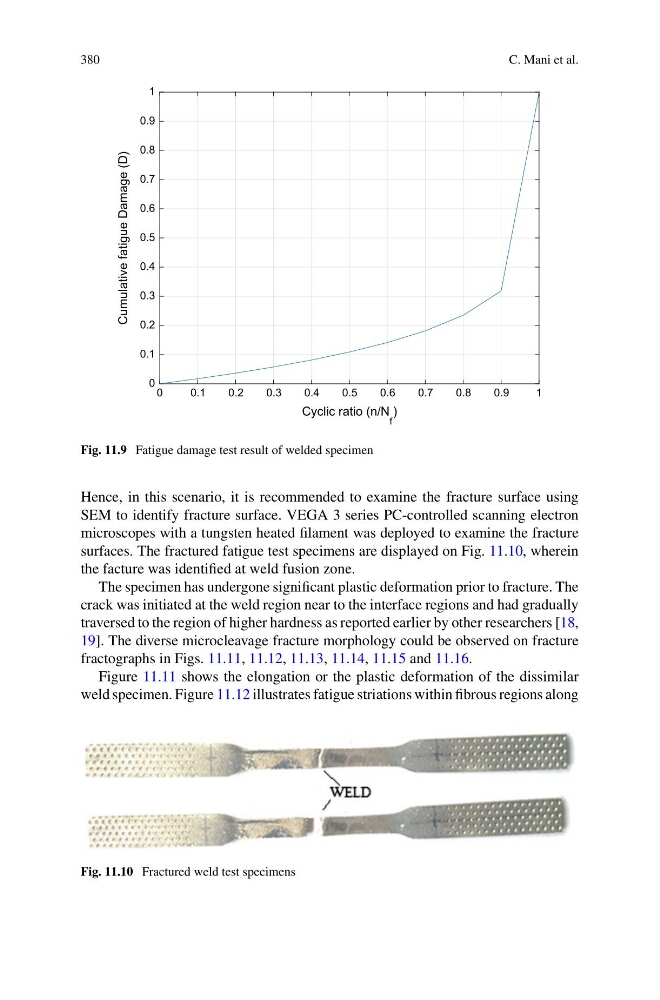
surfaces. The fractured fatigue test specimens are displayed on Fig. 11.10, wherein
the facture was identified at weld fusion zone.
The specimen has undergone significant plastic deformation prior to fracture. The
crack was initiated at the weld region near to the interface regions and had gradually
traversed to the region of higher hardness as reported earlier by other researchers [18,
19]. The diverse microcleavage fracture morphology could be observed on fracture
fractographs in Figs. 11.11, 11.12, 11.13, 11.14, 11.15 and 11.16.
Figure 11.11 shows the elongation or the plastic deformation of the dissimilar
weld specimen. Figure 11.12 illustrates fatigue striations within fibrous regions along
Fig. 11.10 Fractured weld test specimens
C. Mani et al.
0
0.1
0.2
0.3
0.4
0.5
0.6
0.7
0.8
0.9
1
Cyclic ratio (n/N
f
)
0
0.1
0.2
0.3
0.4
0.5
0.6
0.7
0.8
0.9
1
Cumulative fatigue Damage (D)
Fig. 11.9 Fatigue damage test result of welded specimen
Hence, in this scenario, it is recommended to examine the fracture surface using
SEM to identify fracture surface. VEGA 3 series PC-controlled scanning electron
microscopes with a tungsten heated filament was deployed to examine the fracture
surfaces. The fractured fatigue test specimens are displayed on Fig. 11.10, wherein
the facture was identified at weld fusion zone.
The specimen has undergone significant plastic deformation prior to fracture. The
crack was initiated at the weld region near to the interface regions and had gradually
traversed to the region of higher hardness as reported earlier by other researchers [18,
19]. The diverse microcleavage fracture morphology could be observed on fracture
fractographs in Figs. 11.11, 11.12, 11.13, 11.14, 11.15 and 11.16.
Figure 11.11 shows the elongation or the plastic deformation of the dissimilar
weld specimen. Figure 11.12 illustrates fatigue striations within fibrous regions along
Fig. 11.10 Fractured weld test specimens