

378
C. Mani et al.
Table 11.4 Comparison of
endurance
strength/fatiguelimit values
Fatigue design curve
Endurance strength/Fatigue limit
(S e ) (MPa)
Experimentally fitted
97.723
95% survival probability
78.523
Eurocode3
89.125
11.6.2 S-N Curve
Test on 15 welded specimens were carried out, and 12 effective test yielding data
are presented in Table 11.3. All tested specimens are failed at weld region due to
high hardness and geometrical discontinuity. Due to increase in hardness, ductility
decreases, and it becomes more brittle. Due to geometrical discontinuity, more stress
concentration occurs at weld region. These two factors are the primary reasons to
for crack initiation in weld material.
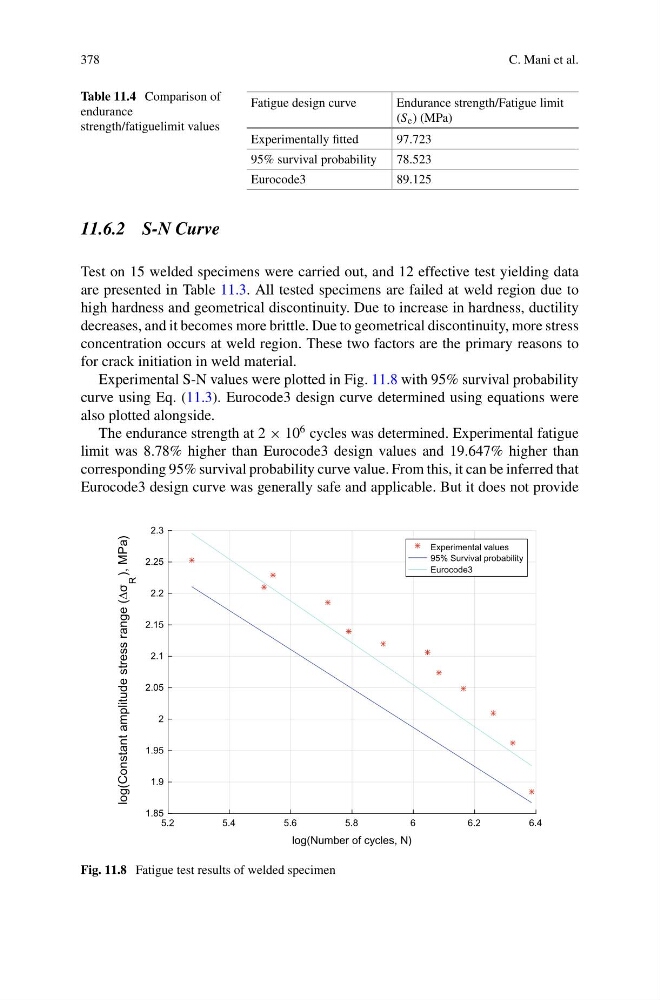
Experimental S-N values were plotted in Fig. 11.8 with 95% survival probability
curve using Eq. (11.3). Eurocode3 design curve determined using equations were
also plotted alongside.
The endurance strength at 2 × 10
6 cycles was determined. Experimental fatigue
limit was 8.78% higher than Eurocode3 design values and 19.647% higher than
corresponding 95% survival probability curve value. From this, it can be inferred that
Eurocode3 design curve was generally safe and applicable. But it does not provide
5.2
5.4
5.6
5.8
6
6.2
6.4
log(Number of cycles, N)
1.85
1.9
1.95
2
2.05
2.1
2.15
2.2
2.25
2.3
log(Constant amplitude stress range (Δσ
R
), MPa)
Experimental values
95% Survival probability
Eurocode3
Fig. 11.8 Fatigue test results of welded specimen
C. Mani et al.
Table 11.4 Comparison of
endurance
strength/fatiguelimit values
Fatigue design curve
Endurance strength/Fatigue limit
(S e ) (MPa)
Experimentally fitted
97.723
95% survival probability
78.523
Eurocode3
89.125
11.6.2 S-N Curve
Test on 15 welded specimens were carried out, and 12 effective test yielding data
are presented in Table 11.3. All tested specimens are failed at weld region due to
high hardness and geometrical discontinuity. Due to increase in hardness, ductility
decreases, and it becomes more brittle. Due to geometrical discontinuity, more stress
concentration occurs at weld region. These two factors are the primary reasons to
for crack initiation in weld material.
Experimental S-N values were plotted in Fig. 11.8 with 95% survival probability
curve using Eq. (11.3). Eurocode3 design curve determined using equations were
also plotted alongside.
The endurance strength at 2 × 10
6 cycles was determined. Experimental fatigue
limit was 8.78% higher than Eurocode3 design values and 19.647% higher than
corresponding 95% survival probability curve value. From this, it can be inferred that
Eurocode3 design curve was generally safe and applicable. But it does not provide
5.2
5.4
5.6
5.8
6
6.2
6.4
log(Number of cycles, N)
1.85
1.9
1.95
2
2.05
2.1
2.15
2.2
2.25
2.3
log(Constant amplitude stress range (Δσ
R
), MPa)
Experimental values
95% Survival probability
Eurocode3
Fig. 11.8 Fatigue test results of welded specimen