

8 Industry 4.0 in Welding
287
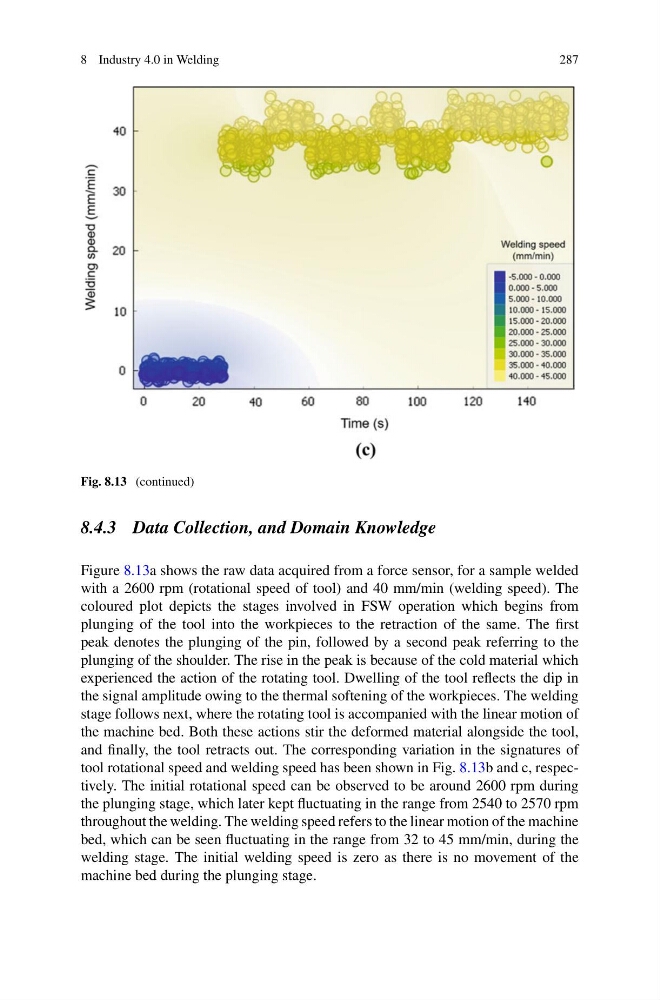
Fig. 8.13 (continued)
8.4.3 Data Collection, and Domain Knowledge
Figure 8.13a shows the raw data acquired from a force sensor, for a sample welded
with a 2600 rpm (rotational speed of tool) and 40 mm/min (welding speed). The
coloured plot depicts the stages involved in FSW operation which begins from
plunging of the tool into the workpieces to the retraction of the same. The first
peak denotes the plunging of the pin, followed by a second peak referring to the
plunging of the shoulder. The rise in the peak is because of the cold material which
experienced the action of the rotating tool. Dwelling of the tool reflects the dip in
the signal amplitude owing to the thermal softening of the workpieces. The welding
stage follows next, where the rotating tool is accompanied with the linear motion of
the machine bed. Both these actions stir the deformed material alongside the tool,
and finally, the tool retracts out. The corresponding variation in the signatures of
tool rotational speed and welding speed has been shown in Fig. 8.13b and c, respectively. The initial rotational speed can be observed to be around 2600 rpm during
the plunging stage, which later kept fluctuating in the range from 2540 to 2570 rpm
throughout the welding. The welding speed refers to the linear motion of the machine
bed, which can be seen fluctuating in the range from 32 to 45 mm/min, during the
welding stage. The initial welding speed is zero as there is no movement of the
machine bed during the plunging stage.
287
Fig. 8.13 (continued)
8.4.3 Data Collection, and Domain Knowledge
Figure 8.13a shows the raw data acquired from a force sensor, for a sample welded
with a 2600 rpm (rotational speed of tool) and 40 mm/min (welding speed). The
coloured plot depicts the stages involved in FSW operation which begins from
plunging of the tool into the workpieces to the retraction of the same. The first
peak denotes the plunging of the pin, followed by a second peak referring to the
plunging of the shoulder. The rise in the peak is because of the cold material which
experienced the action of the rotating tool. Dwelling of the tool reflects the dip in
the signal amplitude owing to the thermal softening of the workpieces. The welding
stage follows next, where the rotating tool is accompanied with the linear motion of
the machine bed. Both these actions stir the deformed material alongside the tool,
and finally, the tool retracts out. The corresponding variation in the signatures of
tool rotational speed and welding speed has been shown in Fig. 8.13b and c, respectively. The initial rotational speed can be observed to be around 2600 rpm during
the plunging stage, which later kept fluctuating in the range from 2540 to 2570 rpm
throughout the welding. The welding speed refers to the linear motion of the machine
bed, which can be seen fluctuating in the range from 32 to 45 mm/min, during the
welding stage. The initial welding speed is zero as there is no movement of the
machine bed during the plunging stage.