

138 Mariana Mazzucato
that in 2013 some development banks (such the World Bank and the European
Investment Bank) decided to curtail funding for coal power (FS-UNEP/BNEF,
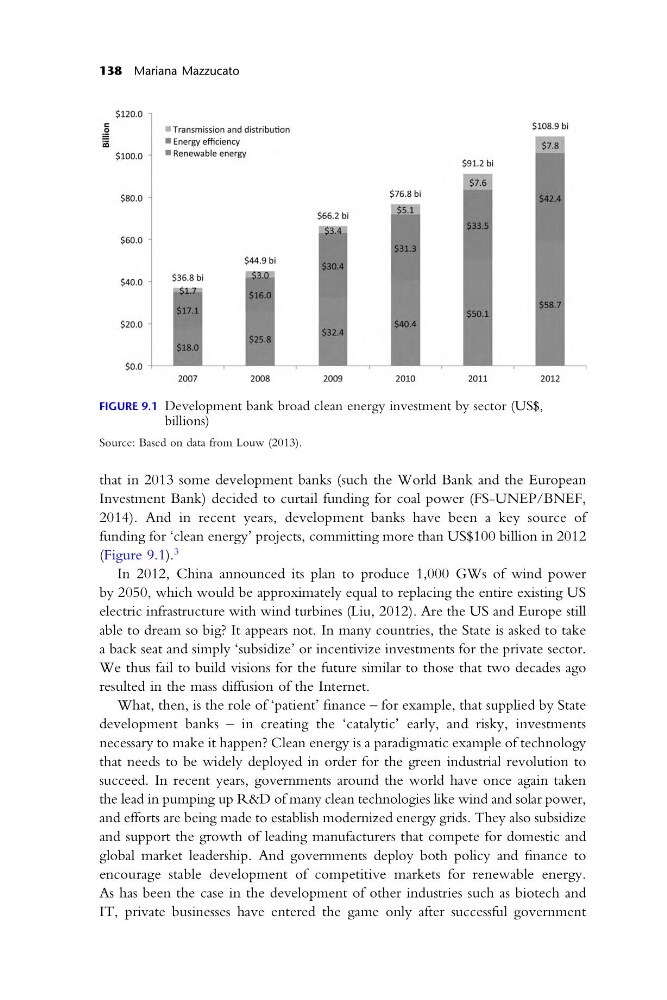
2014). And in recent years, development banks have been a key source of
funding for ‘clean energy’ projects, committing more than US$100 billion in 2012
(Figure 9.1).
3
In 2012, China announced its plan to produce 1,000 GWs of wind power
by 2050, which would be approximately equal to replacing the entire existing US
electric infrastructure with wind turbines (Liu, 2012). Are the US and Europe still
able to dream so big? It appears not. In many countries, the State is asked to take
a back seat and simply ‘subsidize’ or incentivize investments for the private sector.
We thus fail to build visions for the future similar to those that two decades ago
resulted in the mass diffusion of the Internet.
What, then, is the role of ‘patient’ finance – for example, that supplied by State
development banks – in creating the ‘catalytic’ early, and risky, investments
necessary to make it happen? Clean energy is a paradigmatic example of technology
that needs to be widely deployed in order for the green industrial revolution to
succeed. In recent years, governments around the world have once again taken
the lead in pumping up R&D of many clean technologies like wind and solar power,
and efforts are being made to establish modernized energy grids. They also subsidize
and support the growth of leading manufacturers that compete for domestic and
global market leadership. And governments deploy both policy and finance to
encourage stable development of competitive markets for renewable energy.
As has been the case in the development of other industries such as biotech and
IT, private businesses have entered the game only after successful government
FIGURE 9.1 Development bank broad clean energy investment by sector (US$,
billions)
Source: Based on data from Louw (2013).
Billion
$ 1 20.0
$ 1 0 0 .0 -
$80.0
$60.0
$40.0
$ 2 0 .0
$ 0 .0 -
■ Transmission and distribution
■ Energy efficiency
■ Renewable energy
$44.9 bi
$30.4
$32.4
2007
2008
2009
$108.9 bi
$91.2 bi
$7.6
$76.8 bi
$5.1
$33.5
$31.3
$40.4
$50.1
2010
2011
2012
$7.8
$42.4
$58.7
$66.2 b
$3.4
$36.8 b
$1.7
$17.1
$18.0
$3.0
$16.0
$25.8
that in 2013 some development banks (such the World Bank and the European
Investment Bank) decided to curtail funding for coal power (FS-UNEP/BNEF,
2014). And in recent years, development banks have been a key source of
funding for ‘clean energy’ projects, committing more than US$100 billion in 2012
(Figure 9.1).
3
In 2012, China announced its plan to produce 1,000 GWs of wind power
by 2050, which would be approximately equal to replacing the entire existing US
electric infrastructure with wind turbines (Liu, 2012). Are the US and Europe still
able to dream so big? It appears not. In many countries, the State is asked to take
a back seat and simply ‘subsidize’ or incentivize investments for the private sector.
We thus fail to build visions for the future similar to those that two decades ago
resulted in the mass diffusion of the Internet.
What, then, is the role of ‘patient’ finance – for example, that supplied by State
development banks – in creating the ‘catalytic’ early, and risky, investments
necessary to make it happen? Clean energy is a paradigmatic example of technology
that needs to be widely deployed in order for the green industrial revolution to
succeed. In recent years, governments around the world have once again taken
the lead in pumping up R&D of many clean technologies like wind and solar power,
and efforts are being made to establish modernized energy grids. They also subsidize
and support the growth of leading manufacturers that compete for domestic and
global market leadership. And governments deploy both policy and finance to
encourage stable development of competitive markets for renewable energy.
As has been the case in the development of other industries such as biotech and
IT, private businesses have entered the game only after successful government
FIGURE 9.1 Development bank broad clean energy investment by sector (US$,
billions)
Source: Based on data from Louw (2013).
Billion
$ 1 20.0
$ 1 0 0 .0 -
$80.0
$60.0
$40.0
$ 2 0 .0
$ 0 .0 -
■ Transmission and distribution
■ Energy efficiency
■ Renewable energy
$44.9 bi
$30.4
$32.4
2007
2008
2009
$108.9 bi
$91.2 bi
$7.6
$76.8 bi
$5.1
$33.5
$31.3
$40.4
$50.1
2010
2011
2012
$7.8
$42.4
$58.7
$66.2 b
$3.4
$36.8 b
$1.7
$17.1
$18.0
$3.0
$16.0
$25.8