

14.3 Taking and Reducing Spectra
201
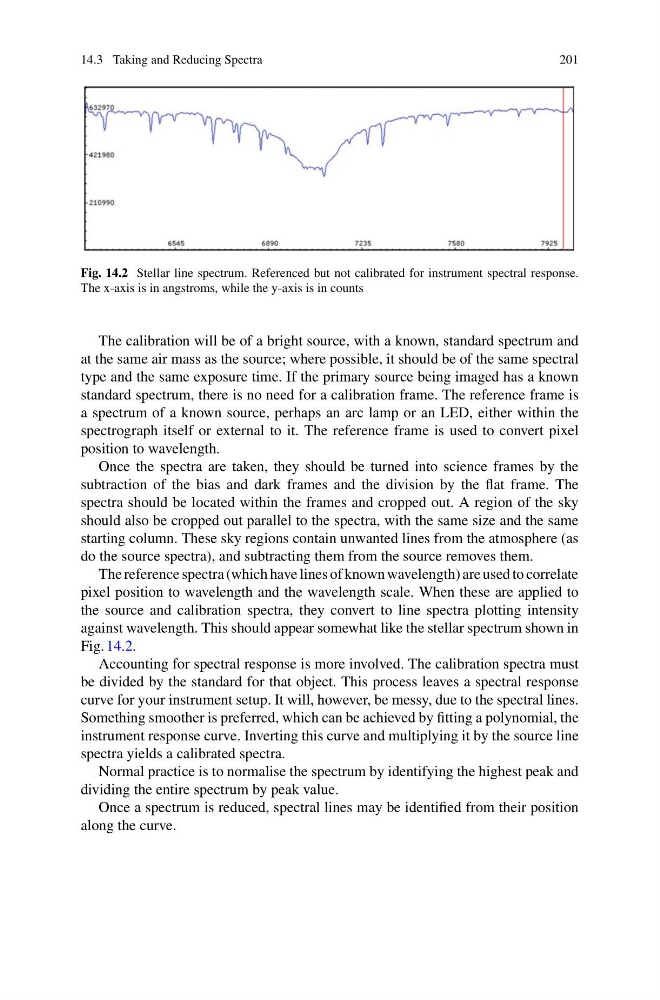
Fig. 14.2 Stellar line spectrum. Referenced but not calibrated for instrument spectral response.
The x-axis is in angstroms, while the y-axis is in counts
The calibration will be of a bright source, with a known, standard spectrum and
at the same air mass as the source; where possible, it should be of the same spectral
type and the same exposure time. If the primary source being imaged has a known
standard spectrum, there is no need for a calibration frame. The reference frame is
a spectrum of a known source, perhaps an arc lamp or an LED, either within the
spectrograph itself or external to it. The reference frame is used to convert pixel
position to wavelength.
Once the spectra are taken, they should be turned into science frames by the
subtraction of the bias and dark frames and the division by the flat frame. The
spectra should be located within the frames and cropped out. A region of the sky
should also be cropped out parallel to the spectra, with the same size and the same
starting column. These sky regions contain unwanted lines from the atmosphere (as
do the source spectra), and subtracting them from the source removes them.
The reference spectra (which have lines of known wavelength) are used to correlate
pixel position to wavelength and the wavelength scale. When these are applied to
the source and calibration spectra, they convert to line spectra plotting intensity
against wavelength. This should appear somewhat like the stellar spectrum shown in
Fig. 14.2.
Accounting for spectral response is more involved. The calibration spectra must
be divided by the standard for that object. This process leaves a spectral response
curve for your instrument setup. It will, however, be messy, due to the spectral lines.
Something smoother is preferred, which can be achieved by fitting a polynomial, the
instrument response curve. Inverting this curve and multiplying it by the source line
spectra yields a calibrated spectra.
Normal practice is to normalise the spectrum by identifying the highest peak and
dividing the entire spectrum by peak value.
Once a spectrum is reduced, spectral lines may be identified from their position
along the curve.
201
Fig. 14.2 Stellar line spectrum. Referenced but not calibrated for instrument spectral response.
The x-axis is in angstroms, while the y-axis is in counts
The calibration will be of a bright source, with a known, standard spectrum and
at the same air mass as the source; where possible, it should be of the same spectral
type and the same exposure time. If the primary source being imaged has a known
standard spectrum, there is no need for a calibration frame. The reference frame is
a spectrum of a known source, perhaps an arc lamp or an LED, either within the
spectrograph itself or external to it. The reference frame is used to convert pixel
position to wavelength.
Once the spectra are taken, they should be turned into science frames by the
subtraction of the bias and dark frames and the division by the flat frame. The
spectra should be located within the frames and cropped out. A region of the sky
should also be cropped out parallel to the spectra, with the same size and the same
starting column. These sky regions contain unwanted lines from the atmosphere (as
do the source spectra), and subtracting them from the source removes them.
The reference spectra (which have lines of known wavelength) are used to correlate
pixel position to wavelength and the wavelength scale. When these are applied to
the source and calibration spectra, they convert to line spectra plotting intensity
against wavelength. This should appear somewhat like the stellar spectrum shown in
Fig. 14.2.
Accounting for spectral response is more involved. The calibration spectra must
be divided by the standard for that object. This process leaves a spectral response
curve for your instrument setup. It will, however, be messy, due to the spectral lines.
Something smoother is preferred, which can be achieved by fitting a polynomial, the
instrument response curve. Inverting this curve and multiplying it by the source line
spectra yields a calibrated spectra.
Normal practice is to normalise the spectrum by identifying the highest peak and
dividing the entire spectrum by peak value.
Once a spectrum is reduced, spectral lines may be identified from their position
along the curve.