

14.2 The Spectrograph
199
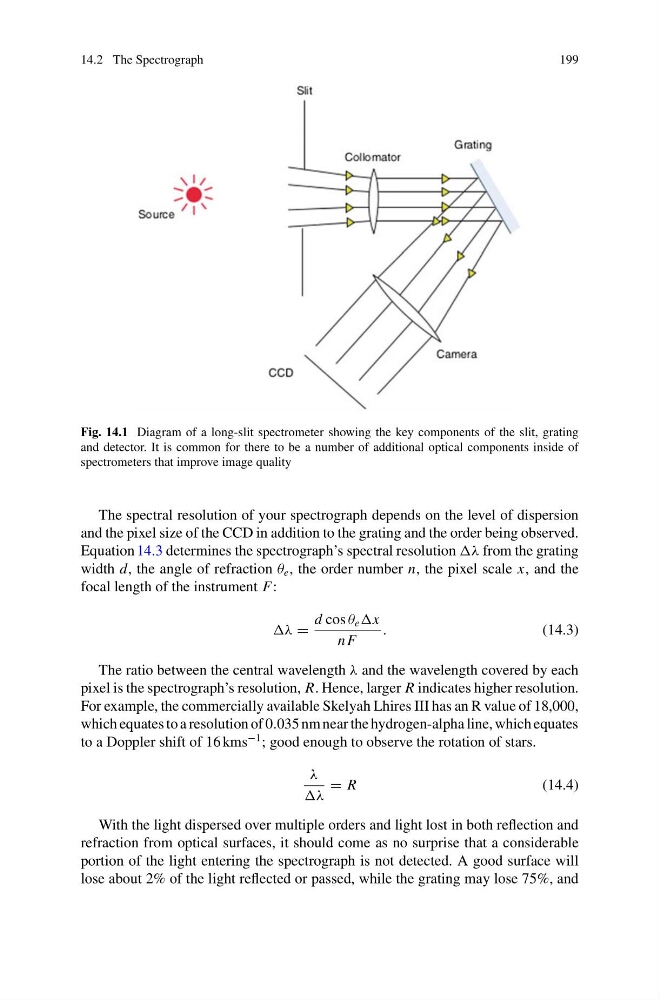
Fig. 14.1 Diagram of a long-slit spectrometer showing the key components of the slit, grating
and detector. It is common for there to be a number of additional optical components inside of
spectrometers that improve image quality
The spectral resolution of your spectrograph depends on the level of dispersion
and the pixel size of the CCD in addition to the grating and the order being observed.
Equation 14.3 determines the spectrograph’s spectral resolution λ from the grating
width d, the angle of refraction θ e , the order number n, the pixel scale x, and the
focal length of the instrument F:
λ =
d cos θ e x
n F
.
(14.3)
The ratio between the central wavelength λ and the wavelength covered by each
pixel is the spectrograph’s resolution, R. Hence, larger R indicates higher resolution.
For example, the commercially available Skelyah Lhires III has an R value of 18,000,
which equates to a resolution of 0.035 nm near the hydrogen-alpha line, which equates
to a Doppler shift of 16 kms
−1 ; good enough to observe the rotation of stars.
λ
λ
= R
(14.4)
With the light dispersed over multiple orders and light lost in both reflection and
refraction from optical surfaces, it should come as no surprise that a considerable
portion of the light entering the spectrograph is not detected. A good surface will
lose about 2% of the light reflected or passed, while the grating may lose 75%, and
199
Fig. 14.1 Diagram of a long-slit spectrometer showing the key components of the slit, grating
and detector. It is common for there to be a number of additional optical components inside of
spectrometers that improve image quality
The spectral resolution of your spectrograph depends on the level of dispersion
and the pixel size of the CCD in addition to the grating and the order being observed.
Equation 14.3 determines the spectrograph’s spectral resolution λ from the grating
width d, the angle of refraction θ e , the order number n, the pixel scale x, and the
focal length of the instrument F:
λ =
d cos θ e x
n F
.
(14.3)
The ratio between the central wavelength λ and the wavelength covered by each
pixel is the spectrograph’s resolution, R. Hence, larger R indicates higher resolution.
For example, the commercially available Skelyah Lhires III has an R value of 18,000,
which equates to a resolution of 0.035 nm near the hydrogen-alpha line, which equates
to a Doppler shift of 16 kms
−1 ; good enough to observe the rotation of stars.
λ
λ
= R
(14.4)
With the light dispersed over multiple orders and light lost in both reflection and
refraction from optical surfaces, it should come as no surprise that a considerable
portion of the light entering the spectrograph is not detected. A good surface will
lose about 2% of the light reflected or passed, while the grating may lose 75%, and