

5 Principle and Processing of Biodiesel Production
135
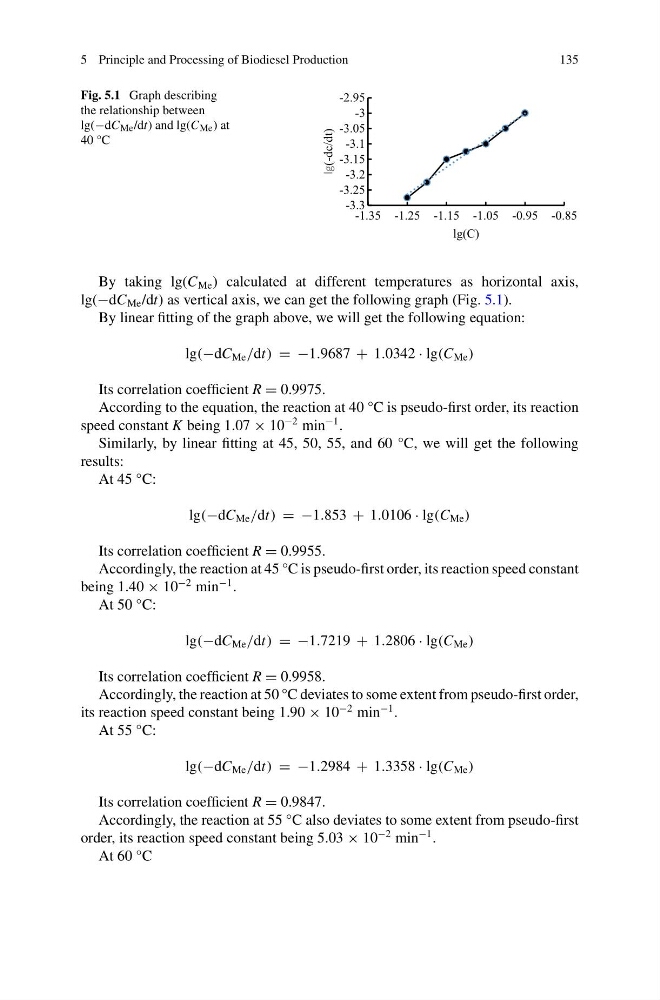
Fig. 5.1 Graph describing
the relationship between
lg(−dC Me /dt) and lg(C Me ) at
40 °C
-3.3
-3.25
-3.2
-3.15
-3.1
-3.05
-3
-2.95
-1.35 -1.25 -1.15 -1.05 -0.95 -0.85
lg(-dc/dt)
lg(C)
By taking lg(C Me ) calculated at different temperatures as horizontal axis,
lg(−dC Me /dt) as vertical axis, we can get the following graph (Fig. 5.1).
By linear fitting of the graph above, we will get the following equation:
lg(−dC Me /dt) = −1.9687 + 1.0342 · lg(C Me )
Its correlation coefficient R = 0.9975.
According to the equation, the reaction at 40 °C is pseudo-first order, its reaction
speed constant K being 1.07 × 10
−2 min
−1 .
Similarly, by linear fitting at 45, 50, 55, and 60 °C, we will get the following
results:
At 45 °C:
lg(−dC Me /dt) = −1.853 + 1.0106 · lg(C Me )
Its correlation coefficient R = 0.9955.
Accordingly, the reaction at 45 °C is pseudo-first order, its reaction speed constant
being 1.40 × 10
−2 min
−1 .
At 50 °C:
lg(−dC Me /dt) = −1.7219 + 1.2806 · lg(C Me )
Its correlation coefficient R = 0.9958.
Accordingly, the reaction at 50 °C deviates to some extent from pseudo-first order,
its reaction speed constant being 1.90 × 10
−2 min
−1 .
At 55 °C:
lg(−dC Me /dt) = −1.2984 + 1.3358 · lg(C Me )
Its correlation coefficient R = 0.9847.
Accordingly, the reaction at 55 °C also deviates to some extent from pseudo-first
order, its reaction speed constant being 5.03 × 10
−2 min
−1 .
At 60 °C
135
Fig. 5.1 Graph describing
the relationship between
lg(−dC Me /dt) and lg(C Me ) at
40 °C
-3.3
-3.25
-3.2
-3.15
-3.1
-3.05
-3
-2.95
-1.35 -1.25 -1.15 -1.05 -0.95 -0.85
lg(-dc/dt)
lg(C)
By taking lg(C Me ) calculated at different temperatures as horizontal axis,
lg(−dC Me /dt) as vertical axis, we can get the following graph (Fig. 5.1).
By linear fitting of the graph above, we will get the following equation:
lg(−dC Me /dt) = −1.9687 + 1.0342 · lg(C Me )
Its correlation coefficient R = 0.9975.
According to the equation, the reaction at 40 °C is pseudo-first order, its reaction
speed constant K being 1.07 × 10
−2 min
−1 .
Similarly, by linear fitting at 45, 50, 55, and 60 °C, we will get the following
results:
At 45 °C:
lg(−dC Me /dt) = −1.853 + 1.0106 · lg(C Me )
Its correlation coefficient R = 0.9955.
Accordingly, the reaction at 45 °C is pseudo-first order, its reaction speed constant
being 1.40 × 10
−2 min
−1 .
At 50 °C:
lg(−dC Me /dt) = −1.7219 + 1.2806 · lg(C Me )
Its correlation coefficient R = 0.9958.
Accordingly, the reaction at 50 °C deviates to some extent from pseudo-first order,
its reaction speed constant being 1.90 × 10
−2 min
−1 .
At 55 °C:
lg(−dC Me /dt) = −1.2984 + 1.3358 · lg(C Me )
Its correlation coefficient R = 0.9847.
Accordingly, the reaction at 55 °C also deviates to some extent from pseudo-first
order, its reaction speed constant being 5.03 × 10
−2 min
−1 .
At 60 °C