

1.5 Technical Channels of Information Leakage
47
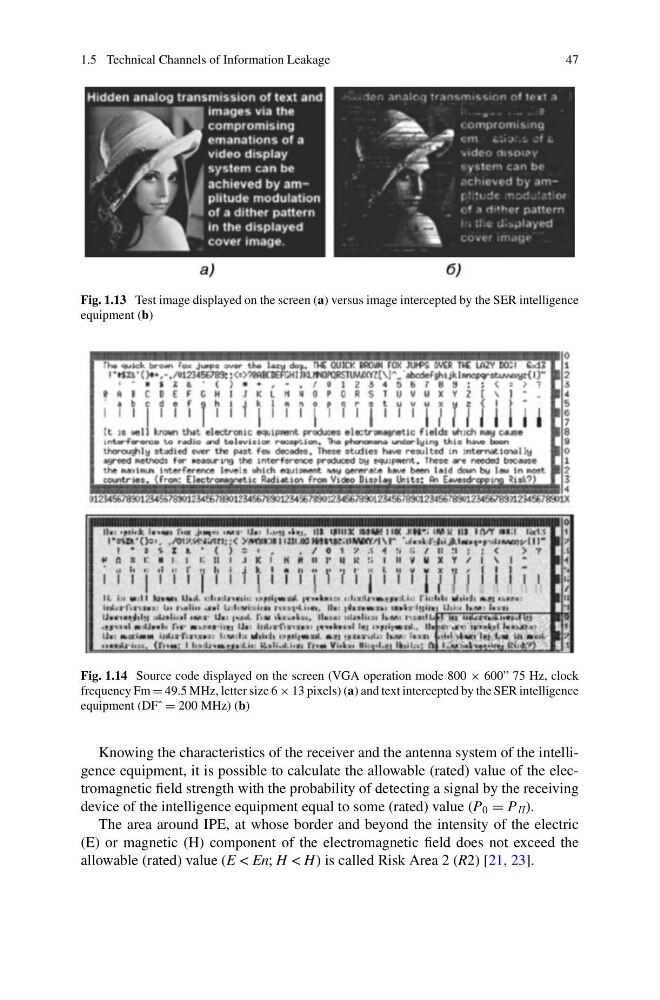
Fig. 1.13 Test image displayed on the screen (a) versus image intercepted by the SER intelligence
equipment (b)
Fig. 1.14 Source code displayed on the screen (VGA operation mode 800 × 600” 75 Hz, clock
frequency Fm = 49.5 MHz, letter size 6 × 13 pixels) (a) and text intercepted by the SER intelligence
equipment (DFˆ = 200 MHz) (b)
Knowing the characteristics of the receiver and the antenna system of the intelligence equipment, it is possible to calculate the allowable (rated) value of the electromagnetic field strength with the probability of detecting a signal by the receiving
device of the intelligence equipment equal to some (rated) value (P 0 = P P ).
The area around IPE, at whose border and beyond the intensity of the electric
(E) or magnetic (H) component of the electromagnetic field does not exceed the
allowable (rated) value (E < En; H < H) is called Risk Area 2 (R2) [21, 23].
47
Fig. 1.13 Test image displayed on the screen (a) versus image intercepted by the SER intelligence
equipment (b)
Fig. 1.14 Source code displayed on the screen (VGA operation mode 800 × 600” 75 Hz, clock
frequency Fm = 49.5 MHz, letter size 6 × 13 pixels) (a) and text intercepted by the SER intelligence
equipment (DFˆ = 200 MHz) (b)
Knowing the characteristics of the receiver and the antenna system of the intelligence equipment, it is possible to calculate the allowable (rated) value of the electromagnetic field strength with the probability of detecting a signal by the receiving
device of the intelligence equipment equal to some (rated) value (P 0 = P P ).
The area around IPE, at whose border and beyond the intensity of the electric
(E) or magnetic (H) component of the electromagnetic field does not exceed the
allowable (rated) value (E < En; H < H) is called Risk Area 2 (R2) [21, 23].