

282
4 Hardware Trojans in Microcircuits
articles were published in 2008, 10 years later, in 2017, the total number of published
articles amounted to 112 (grew more than 10 times), including 22 review articles.
An interesting pattern is revealed as a result of the analysis of these publications
according to their purpose. After dividing the publications into three groups (reviews,
Trojan protection methods, and Trojan development methods), we can draw the
following obvious conclusions (Fig. 4.4b).
The number of publications dedicated to methods of protection from hardware
Trojans has increased by an order of magnitude over the last 10 years, and this
tendency is increasing. At the same time, the number of publications dedicated
to the study of various methods of Trojan creation started decreasing after 2013
from a dozen per year (within 2010–2014) to only three articles in 2017. This, of
course, doesn’t indicate a decrease in the interest of researchers to this subject; on
the opposite, we probably see here the overdue indirect influence of the relevant
special services—after all, these publications can be read not only by well-bred
engineers, but also by hackers and overly active and curious students, who can use
these publications as tutorials.
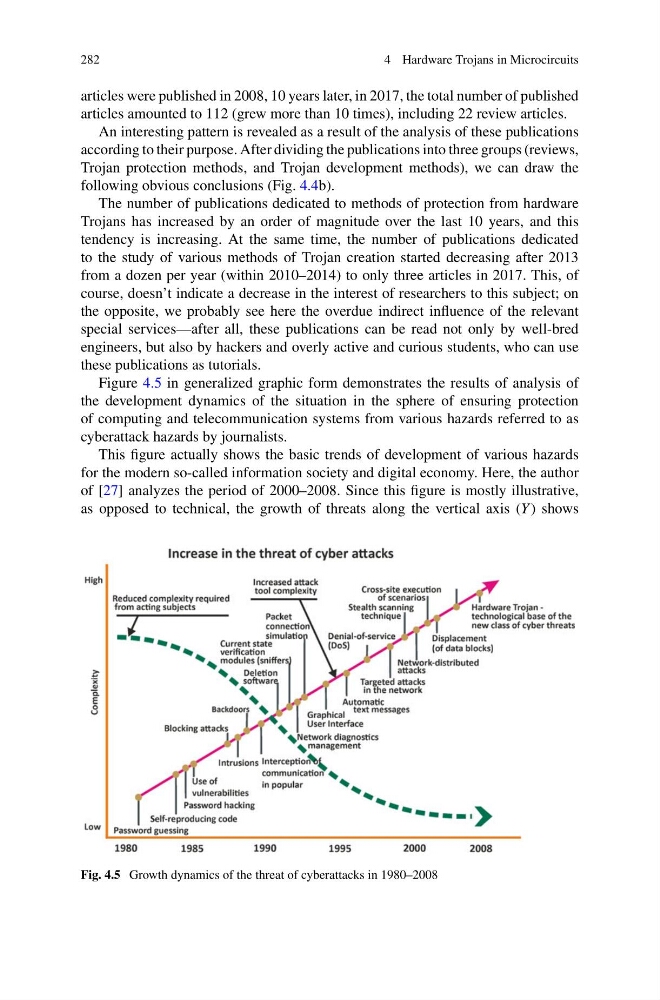
Figure 4.5 in generalized graphic form demonstrates the results of analysis of
the development dynamics of the situation in the sphere of ensuring protection
of computing and telecommunication systems from various hazards referred to as
cyberattack hazards by journalists.
This figure actually shows the basic trends of development of various hazards
for the modern so-called information society and digital economy. Here, the author
of [27] analyzes the period of 2000–2008. Since this figure is mostly illustrative,
as opposed to technical, the growth of threats along the vertical axis (Y ) shows
Fig. 4.5 Growth dynamics of the threat of cyberattacks in 1980–2008
4 Hardware Trojans in Microcircuits
articles were published in 2008, 10 years later, in 2017, the total number of published
articles amounted to 112 (grew more than 10 times), including 22 review articles.
An interesting pattern is revealed as a result of the analysis of these publications
according to their purpose. After dividing the publications into three groups (reviews,
Trojan protection methods, and Trojan development methods), we can draw the
following obvious conclusions (Fig. 4.4b).
The number of publications dedicated to methods of protection from hardware
Trojans has increased by an order of magnitude over the last 10 years, and this
tendency is increasing. At the same time, the number of publications dedicated
to the study of various methods of Trojan creation started decreasing after 2013
from a dozen per year (within 2010–2014) to only three articles in 2017. This, of
course, doesn’t indicate a decrease in the interest of researchers to this subject; on
the opposite, we probably see here the overdue indirect influence of the relevant
special services—after all, these publications can be read not only by well-bred
engineers, but also by hackers and overly active and curious students, who can use
these publications as tutorials.
Figure 4.5 in generalized graphic form demonstrates the results of analysis of
the development dynamics of the situation in the sphere of ensuring protection
of computing and telecommunication systems from various hazards referred to as
cyberattack hazards by journalists.
This figure actually shows the basic trends of development of various hazards
for the modern so-called information society and digital economy. Here, the author
of [27] analyzes the period of 2000–2008. Since this figure is mostly illustrative,
as opposed to technical, the growth of threats along the vertical axis (Y ) shows
Fig. 4.5 Growth dynamics of the threat of cyberattacks in 1980–2008