

9 Emerging Hardware Technologies for IoT Data Processing
455
Gene Micro Array
Input Dataset
x 00 ... x 0M
x 10 ... x 1M
x 20 ... x 2M
x 30 ... x 3M
x 40 ... x 4M
x 50 ... x 5M
Gene 0
Gene 1
Gene 2
Gene 3
Gene 4
Gene 5
Clustered Data
c 00 ... c 0M
c 10 ... c 1M
c 20 ... c 2M
cancerous
non-cancerous
Results
K-means
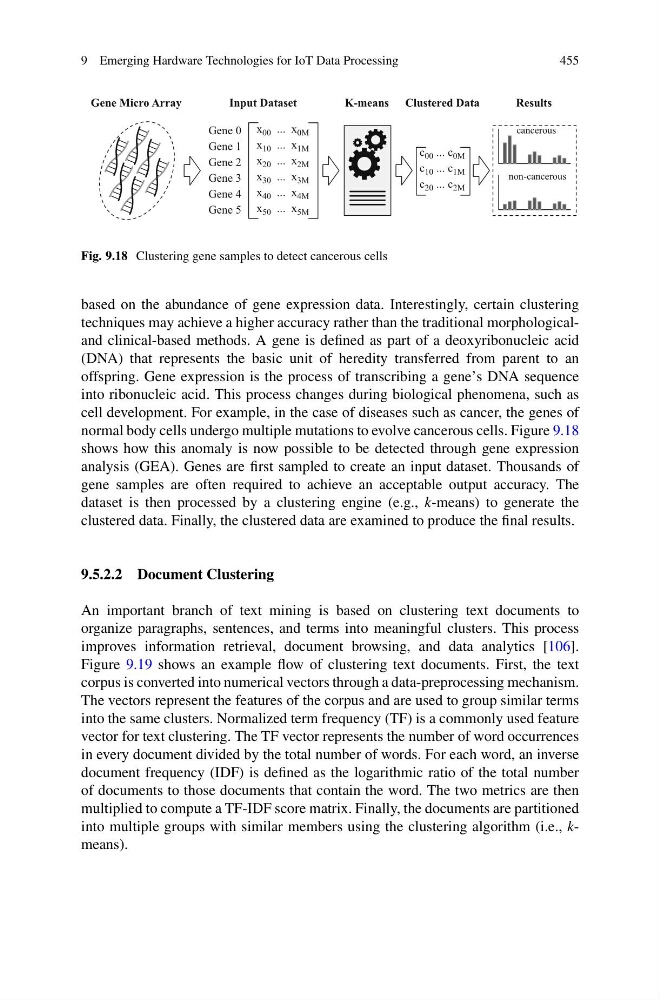
Fig. 9.18 Clustering gene samples to detect cancerous cells
based on the abundance of gene expression data. Interestingly, certain clustering
techniques may achieve a higher accuracy rather than the traditional morphologicaland clinical-based methods. A gene is defined as part of a deoxyribonucleic acid
(DNA) that represents the basic unit of heredity transferred from parent to an
offspring. Gene expression is the process of transcribing a gene’s DNA sequence
into ribonucleic acid. This process changes during biological phenomena, such as
cell development. For example, in the case of diseases such as cancer, the genes of
normal body cells undergo multiple mutations to evolve cancerous cells. Figure 9.18
shows how this anomaly is now possible to be detected through gene expression
analysis (GEA). Genes are first sampled to create an input dataset. Thousands of
gene samples are often required to achieve an acceptable output accuracy. The
dataset is then processed by a clustering engine (e.g., k-means) to generate the
clustered data. Finally, the clustered data are examined to produce the final results.
9.5.2.2 Document Clustering
An important branch of text mining is based on clustering text documents to
organize paragraphs, sentences, and terms into meaningful clusters. This process
improves information retrieval, document browsing, and data analytics [106].
Figure 9.19 shows an example flow of clustering text documents. First, the text
corpus is converted into numerical vectors through a data-preprocessing mechanism.
The vectors represent the features of the corpus and are used to group similar terms
into the same clusters. Normalized term frequency (TF) is a commonly used feature
vector for text clustering. The TF vector represents the number of word occurrences
in every document divided by the total number of words. For each word, an inverse
document frequency (IDF) is defined as the logarithmic ratio of the total number
of documents to those documents that contain the word. The two metrics are then
multiplied to compute a TF-IDF score matrix. Finally, the documents are partitioned
into multiple groups with similar members using the clustering algorithm (i.e., kmeans).
455
Gene Micro Array
Input Dataset
x 00 ... x 0M
x 10 ... x 1M
x 20 ... x 2M
x 30 ... x 3M
x 40 ... x 4M
x 50 ... x 5M
Gene 0
Gene 1
Gene 2
Gene 3
Gene 4
Gene 5
Clustered Data
c 00 ... c 0M
c 10 ... c 1M
c 20 ... c 2M
cancerous
non-cancerous
Results
K-means
Fig. 9.18 Clustering gene samples to detect cancerous cells
based on the abundance of gene expression data. Interestingly, certain clustering
techniques may achieve a higher accuracy rather than the traditional morphologicaland clinical-based methods. A gene is defined as part of a deoxyribonucleic acid
(DNA) that represents the basic unit of heredity transferred from parent to an
offspring. Gene expression is the process of transcribing a gene’s DNA sequence
into ribonucleic acid. This process changes during biological phenomena, such as
cell development. For example, in the case of diseases such as cancer, the genes of
normal body cells undergo multiple mutations to evolve cancerous cells. Figure 9.18
shows how this anomaly is now possible to be detected through gene expression
analysis (GEA). Genes are first sampled to create an input dataset. Thousands of
gene samples are often required to achieve an acceptable output accuracy. The
dataset is then processed by a clustering engine (e.g., k-means) to generate the
clustered data. Finally, the clustered data are examined to produce the final results.
9.5.2.2 Document Clustering
An important branch of text mining is based on clustering text documents to
organize paragraphs, sentences, and terms into meaningful clusters. This process
improves information retrieval, document browsing, and data analytics [106].
Figure 9.19 shows an example flow of clustering text documents. First, the text
corpus is converted into numerical vectors through a data-preprocessing mechanism.
The vectors represent the features of the corpus and are used to group similar terms
into the same clusters. Normalized term frequency (TF) is a commonly used feature
vector for text clustering. The TF vector represents the number of word occurrences
in every document divided by the total number of words. For each word, an inverse
document frequency (IDF) is defined as the logarithmic ratio of the total number
of documents to those documents that contain the word. The two metrics are then
multiplied to compute a TF-IDF score matrix. Finally, the documents are partitioned
into multiple groups with similar members using the clustering algorithm (i.e., kmeans).