

5 Machine Learning for IoT
277
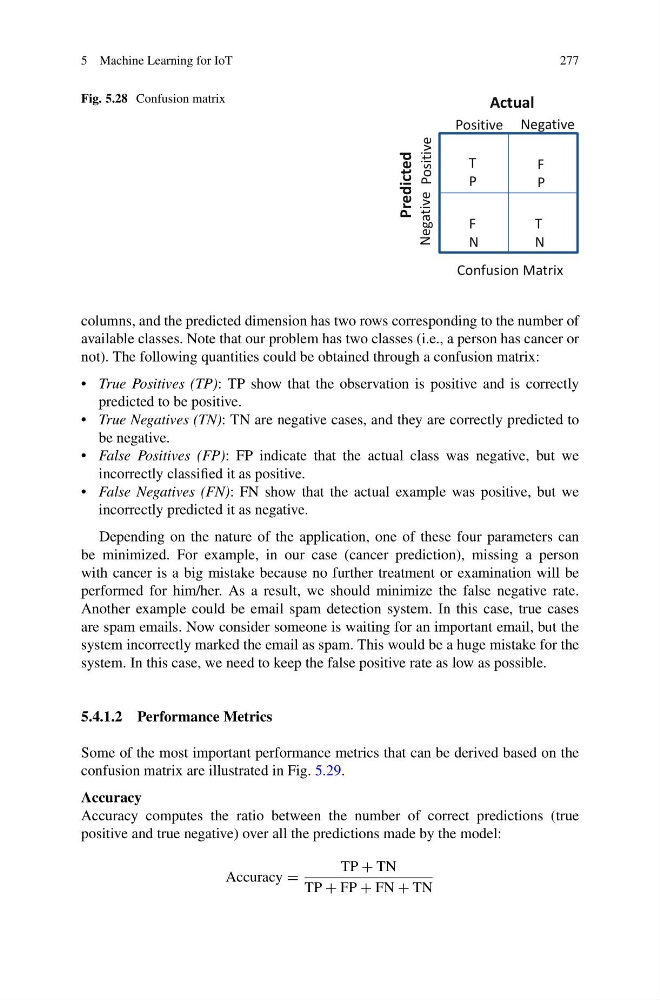
Fig. 5.28 Confusion matrix
T
P
F
P
F
N
T
N
d
e
t
c
i
d
e
r
P
Actual
Positive Negative
Positive
Negative
Confusion Matrix
columns, and the predicted dimension has two rows corresponding to the number of
available classes. Note that our problem has two classes (i.e., a person has cancer or
not). The following quantities could be obtained through a confusion matrix:
• True Positives (TP): TP show that the observation is positive and is correctly
predicted to be positive.
• True Negatives (TN): TN are negative cases, and they are correctly predicted to
be negative.
• False Positives (FP): FP indicate that the actual class was negative, but we
incorrectly classified it as positive.
• False Negatives (FN): FN show that the actual example was positive, but we
incorrectly predicted it as negative.
Depending on the nature of the application, one of these four parameters can
be minimized. For example, in our case (cancer prediction), missing a person
with cancer is a big mistake because no further treatment or examination will be
performed for him/her. As a result, we should minimize the false negative rate.
Another example could be email spam detection system. In this case, true cases
are spam emails. Now consider someone is waiting for an important email, but the
system incorrectly marked the email as spam. This would be a huge mistake for the
system. In this case, we need to keep the false positive rate as low as possible.
5.4.1.2 Performance Metrics
Some of the most important performance metrics that can be derived based on the
confusion matrix are illustrated in Fig. 5.29.
Accuracy
Accuracy computes the ratio between the number of correct predictions (true
positive and true negative) over all the predictions made by the model:
Accuracy =
TP + TN
TP + FP + FN + TN
277
Fig. 5.28 Confusion matrix
T
P
F
P
F
N
T
N
d
e
t
c
i
d
e
r
P
Actual
Positive Negative
Positive
Negative
Confusion Matrix
columns, and the predicted dimension has two rows corresponding to the number of
available classes. Note that our problem has two classes (i.e., a person has cancer or
not). The following quantities could be obtained through a confusion matrix:
• True Positives (TP): TP show that the observation is positive and is correctly
predicted to be positive.
• True Negatives (TN): TN are negative cases, and they are correctly predicted to
be negative.
• False Positives (FP): FP indicate that the actual class was negative, but we
incorrectly classified it as positive.
• False Negatives (FN): FN show that the actual example was positive, but we
incorrectly predicted it as negative.
Depending on the nature of the application, one of these four parameters can
be minimized. For example, in our case (cancer prediction), missing a person
with cancer is a big mistake because no further treatment or examination will be
performed for him/her. As a result, we should minimize the false negative rate.
Another example could be email spam detection system. In this case, true cases
are spam emails. Now consider someone is waiting for an important email, but the
system incorrectly marked the email as spam. This would be a huge mistake for the
system. In this case, we need to keep the false positive rate as low as possible.
5.4.1.2 Performance Metrics
Some of the most important performance metrics that can be derived based on the
confusion matrix are illustrated in Fig. 5.29.
Accuracy
Accuracy computes the ratio between the number of correct predictions (true
positive and true negative) over all the predictions made by the model:
Accuracy =
TP + TN
TP + FP + FN + TN