

44
3 Simulating Droplet Microfluidic Networks
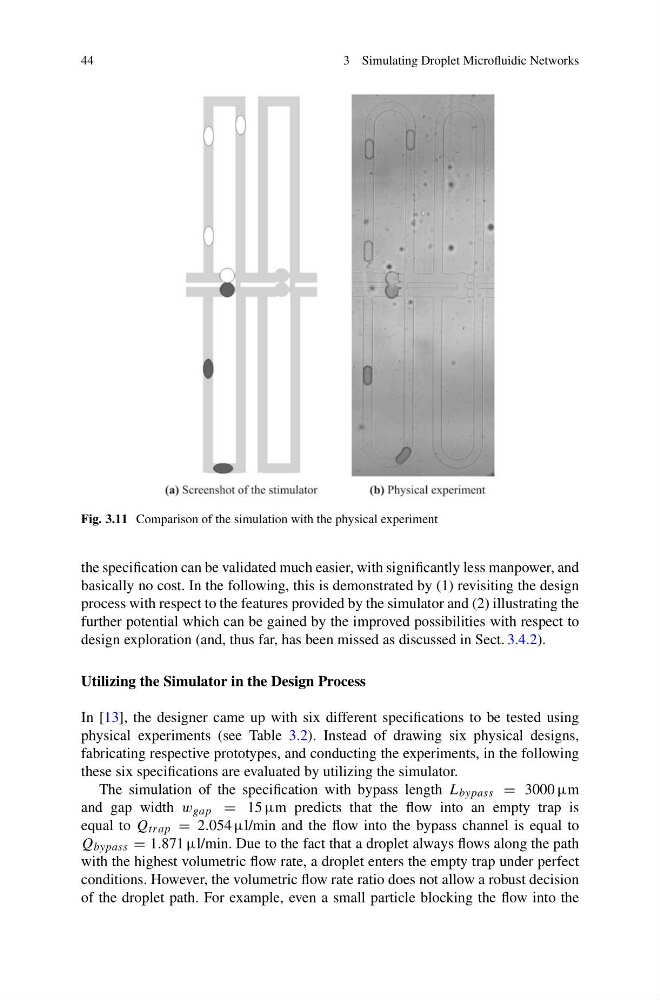
Fig. 3.11 Comparison of the simulation with the physical experiment
the specification can be validated much easier, with significantly less manpower, and
basically no cost. In the following, this is demonstrated by (1) revisiting the design
process with respect to the features provided by the simulator and (2) illustrating the
further potential which can be gained by the improved possibilities with respect to
design exploration (and, thus far, has been missed as discussed in Sect. 3.4.2).
Utilizing the Simulator in the Design Process
In [13], the designer came up with six different specifications to be tested using
physical experiments (see Table 3.2). Instead of drawing six physical designs,
fabricating respective prototypes, and conducting the experiments, in the following
these six specifications are evaluated by utilizing the simulator.
The simulation of the specification with bypass length L bypass = 3000 μm
and gap width w gap = 15 μm predicts that the flow into an empty trap is
equal to Q trap = 2.054 μl/min and the flow into the bypass channel is equal to
Q bypass = 1.871 μl/min. Due to the fact that a droplet always flows along the path
with the highest volumetric flow rate, a droplet enters the empty trap under perfect
conditions. However, the volumetric flow rate ratio does not allow a robust decision
of the droplet path. For example, even a small particle blocking the flow into the
3 Simulating Droplet Microfluidic Networks
Fig. 3.11 Comparison of the simulation with the physical experiment
the specification can be validated much easier, with significantly less manpower, and
basically no cost. In the following, this is demonstrated by (1) revisiting the design
process with respect to the features provided by the simulator and (2) illustrating the
further potential which can be gained by the improved possibilities with respect to
design exploration (and, thus far, has been missed as discussed in Sect. 3.4.2).
Utilizing the Simulator in the Design Process
In [13], the designer came up with six different specifications to be tested using
physical experiments (see Table 3.2). Instead of drawing six physical designs,
fabricating respective prototypes, and conducting the experiments, in the following
these six specifications are evaluated by utilizing the simulator.
The simulation of the specification with bypass length L bypass = 3000 μm
and gap width w gap = 15 μm predicts that the flow into an empty trap is
equal to Q trap = 2.054 μl/min and the flow into the bypass channel is equal to
Q bypass = 1.871 μl/min. Due to the fact that a droplet always flows along the path
with the highest volumetric flow rate, a droplet enters the empty trap under perfect
conditions. However, the volumetric flow rate ratio does not allow a robust decision
of the droplet path. For example, even a small particle blocking the flow into the