

0
0.1
6
4
2
0
–2
–4
0.2
0.3
0.4
Voltage/V
(a)
–6
30
20
10
0
–10
–20
–0.8
–0.6
–0.4
–0.2
0
0.2
0.4
0.6
E/V vs Hg/Hg 2 SO 4
(b)
I/mA
I/mA
0.5
281
Characterization and Diagnosis Techniques
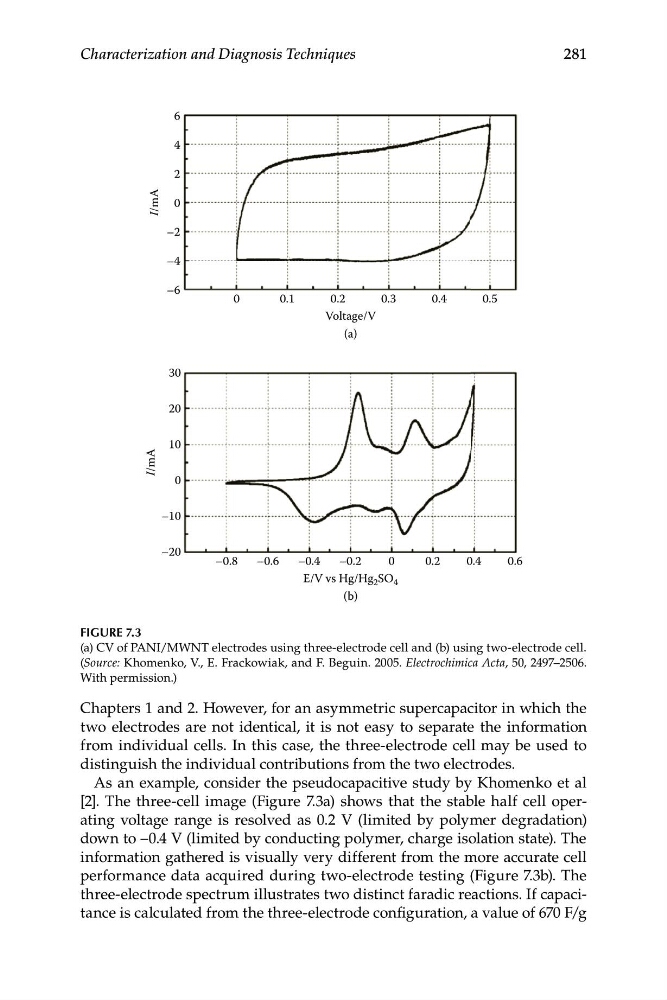
FIGURE 7.3
(a) CV of PANI/MWNT electrodes using three-electrode cell and (b) using two-electrode cell.
(Source: Khomenko, V., E. Frackowiak, and F. Beguin. 2005. Electrochimica Acta, 50, 2497–2506.
With permission.)
Chapters 1 and 2. However, for an asymmetric supercapacitor in which the
two electrodes are not identical, it is not easy to separate the information
from individual cells. In this case, the three-electrode cell may be used to
distinguish the individual contributions from the two electrodes.
As an example, consider the pseudocapacitive study by Khomenko et al
[2]. The three-cell image (Figure 7.3a) shows that the stable half cell operating voltage range is resolved as 0.2 V (limited by polymer degradation)
down to –0.4 V (limited by conducting polymer, charge isolation state). The
information gathered is visually very different from the more accurate cell
performance data acquired during two-electrode testing (Figure 7.3b). The
three-electrode spectrum illustrates two distinct faradic reactions. If capacitance is calculated from the three-electrode configuration, a value of 670 F/g
0.1
6
4
2
0
–2
–4
0.2
0.3
0.4
Voltage/V
(a)
–6
30
20
10
0
–10
–20
–0.8
–0.6
–0.4
–0.2
0
0.2
0.4
0.6
E/V vs Hg/Hg 2 SO 4
(b)
I/mA
I/mA
0.5
281
Characterization and Diagnosis Techniques
FIGURE 7.3
(a) CV of PANI/MWNT electrodes using three-electrode cell and (b) using two-electrode cell.
(Source: Khomenko, V., E. Frackowiak, and F. Beguin. 2005. Electrochimica Acta, 50, 2497–2506.
With permission.)
Chapters 1 and 2. However, for an asymmetric supercapacitor in which the
two electrodes are not identical, it is not easy to separate the information
from individual cells. In this case, the three-electrode cell may be used to
distinguish the individual contributions from the two electrodes.
As an example, consider the pseudocapacitive study by Khomenko et al
[2]. The three-cell image (Figure 7.3a) shows that the stable half cell operating voltage range is resolved as 0.2 V (limited by polymer degradation)
down to –0.4 V (limited by conducting polymer, charge isolation state). The
information gathered is visually very different from the more accurate cell
performance data acquired during two-electrode testing (Figure 7.3b). The
three-electrode spectrum illustrates two distinct faradic reactions. If capacitance is calculated from the three-electrode configuration, a value of 670 F/g