

164
Electrochemical Supercapacitors for Energy Storage and Delivery
250
10
2
SSG (IL, 4V)
Energy Density (Wh/kg)
SSG
Freeze-dried SSG
Dried/thermally
annealed SSG
0
200
400
200
150
100
C (F g –1
)
s
10
1
10
0
50
0
600
800
1000
1
1 0
100
Current Density (A g –1 )
Ave. Power Density (kW/kg)
(a)
(b)
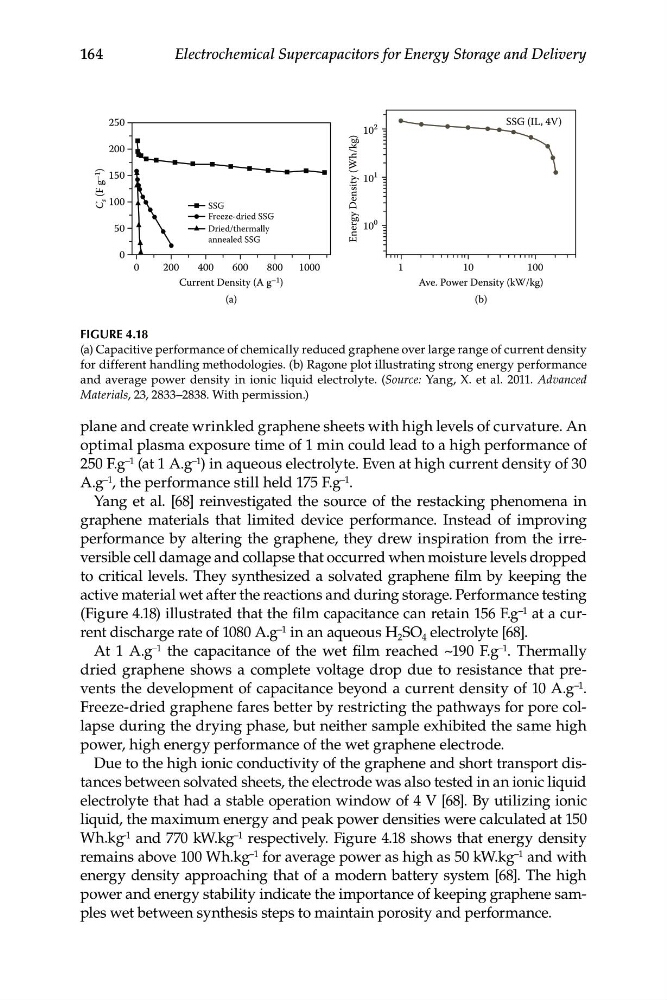
FIGURE 4.18
(a) Capacitive performance of chemically reduced graphene over large range of current density
for different handling methodologies. (b) Ragone plot illustrating strong energy performance
and average power density in ionic liquid electrolyte. (Source: Yang, X. et al. 2011. Advanced
Materials, 23, 2833–2838. With permission.)
plane and create wrinkled graphene sheets with high levels of curvature. An
optimal plasma exposure time of 1 min could lead to a high performance of
250 F.g –1 (at 1 A.g –1 ) in aqueous electrolyte. Even at high current density of 30
A.g –1 , the performance still held 175 F.g –1 .
Yang et al. [68] reinvestigated the source of the restacking phenomena in
graphene materials that limited device performance. Instead of improving
performance by altering the graphene, they drew inspiration from the irreversible cell damage and collapse that occurred when moisture levels dropped
to critical levels. They synthesized a solvated graphene film by keeping the
active material wet after the reactions and during storage. Performance testing
(Figure 4.18) illustrated that the film capacitance can retain 156 F.g –1 at a current discharge rate of 1080 A.g –1 in an aqueous H 2 SO 4 electrolyte [68].
At 1 A.g –1 the capacitance of the wet film reached ~190 F.g –1 . Thermally
dried graphene shows a complete voltage drop due to resistance that prevents the development of capacitance beyond a current density of 10 A.g –1 .
Freeze-dried graphene fares better by restricting the pathways for pore collapse during the drying phase, but neither sample exhibited the same high
power, high energy performance of the wet graphene electrode.
Due to the high ionic conductivity of the graphene and short transport distances between solvated sheets, the electrode was also tested in an ionic liquid
electrolyte that had a stable operation window of 4 V [68]. By utilizing ionic
liquid, the maximum energy and peak power densities were calculated at 150
Wh.kg -1 and 770 kW.kg –1 respectively. Figure 4.18 shows that energy density
remains above 100 Wh.kg –1 for average power as high as 50 kW.kg –1 and with
energy density approaching that of a modern battery system [68]. The high
power and energy stability indicate the importance of keeping graphene samples wet between synthesis steps to maintain porosity and performance.
Electrochemical Supercapacitors for Energy Storage and Delivery
250
10
2
SSG (IL, 4V)
Energy Density (Wh/kg)
SSG
Freeze-dried SSG
Dried/thermally
annealed SSG
0
200
400
200
150
100
C (F g –1
)
s
10
1
10
0
50
0
600
800
1000
1
1 0
100
Current Density (A g –1 )
Ave. Power Density (kW/kg)
(a)
(b)
FIGURE 4.18
(a) Capacitive performance of chemically reduced graphene over large range of current density
for different handling methodologies. (b) Ragone plot illustrating strong energy performance
and average power density in ionic liquid electrolyte. (Source: Yang, X. et al. 2011. Advanced
Materials, 23, 2833–2838. With permission.)
plane and create wrinkled graphene sheets with high levels of curvature. An
optimal plasma exposure time of 1 min could lead to a high performance of
250 F.g –1 (at 1 A.g –1 ) in aqueous electrolyte. Even at high current density of 30
A.g –1 , the performance still held 175 F.g –1 .
Yang et al. [68] reinvestigated the source of the restacking phenomena in
graphene materials that limited device performance. Instead of improving
performance by altering the graphene, they drew inspiration from the irreversible cell damage and collapse that occurred when moisture levels dropped
to critical levels. They synthesized a solvated graphene film by keeping the
active material wet after the reactions and during storage. Performance testing
(Figure 4.18) illustrated that the film capacitance can retain 156 F.g –1 at a current discharge rate of 1080 A.g –1 in an aqueous H 2 SO 4 electrolyte [68].
At 1 A.g –1 the capacitance of the wet film reached ~190 F.g –1 . Thermally
dried graphene shows a complete voltage drop due to resistance that prevents the development of capacitance beyond a current density of 10 A.g –1 .
Freeze-dried graphene fares better by restricting the pathways for pore collapse during the drying phase, but neither sample exhibited the same high
power, high energy performance of the wet graphene electrode.
Due to the high ionic conductivity of the graphene and short transport distances between solvated sheets, the electrode was also tested in an ionic liquid
electrolyte that had a stable operation window of 4 V [68]. By utilizing ionic
liquid, the maximum energy and peak power densities were calculated at 150
Wh.kg -1 and 770 kW.kg –1 respectively. Figure 4.18 shows that energy density
remains above 100 Wh.kg –1 for average power as high as 50 kW.kg –1 and with
energy density approaching that of a modern battery system [68]. The high
power and energy stability indicate the importance of keeping graphene samples wet between synthesis steps to maintain porosity and performance.