

2.4
2.2
2.0
1.8
EMF/V
Li/TiS 2
0.1
1
Lithium Concentration in TiS 2
113
Fundamentals of Electrochemical Pseudocapacitors
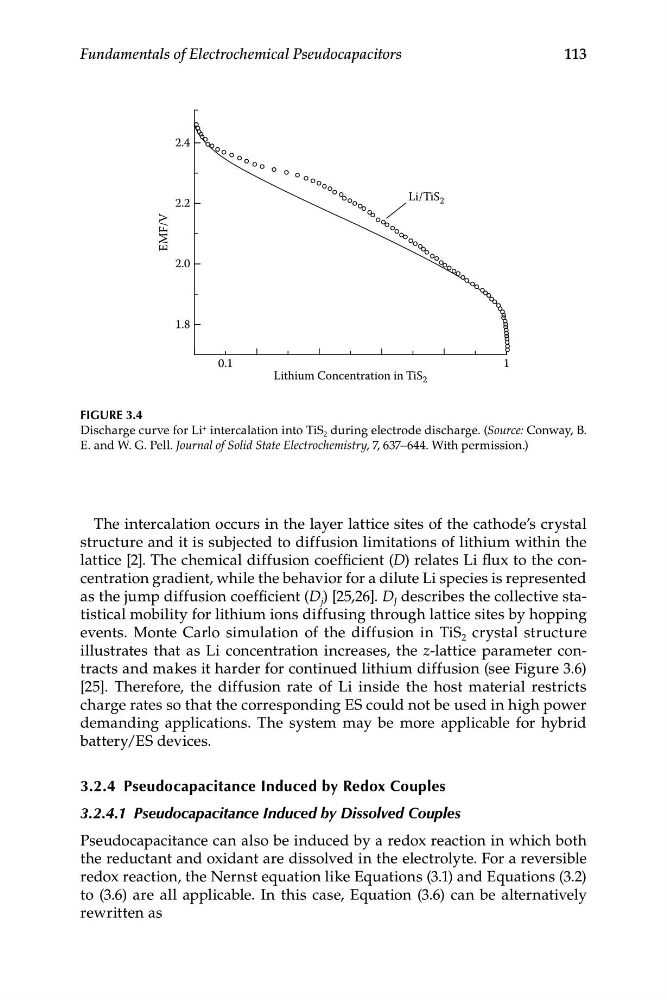
FIGURE 3.4
Discharge curve for Li + intercalation into TiS 2 during electrode discharge. (Source: Conway, B.
E. and W. G. Pell. Journal of Solid State Electrochemistry, 7, 637–644. With permission.)
The intercalation occurs in the layer lattice sites of the cathode’s crystal
structure and it is subjected to diffusion limitations of lithium within the
lattice [2]. The chemical diffusion coefficient (D) relates Li flux to the concentration gradient, while the behavior for a dilute Li species is represented
as the jump diffusion coefficient (D j ) [25,26]. D J describes the collective statistical mobility for lithium ions diffusing through lattice sites by hopping
events. Monte Carlo simulation of the diffusion in TiS 2 crystal structure
illustrates that as Li concentration increases, the z-lattice parameter contracts and makes it harder for continued lithium diffusion (see Figure 3.6)
[25]. Therefore, the diffusion rate of Li inside the host material restricts
charge rates so that the corresponding ES could not be used in high power
demanding applications. The system may be more applicable for hybrid
battery/ES devices.
3.2.4 Pseudocapacitance Induced by Redox Couples
3.2.4.1 Pseudocapacitance Induced by Dissolved Couples
Pseudocapacitance can also be induced by a redox reaction in which both
the reductant and oxidant are dissolved in the electrolyte. For a reversible
redox reaction, the Nernst equation like Equations (3.1) and Equations (3.2)
to (3.6) are all applicable. In this case, Equation (3.6) can be alternatively
rewritten as
2.2
2.0
1.8
EMF/V
Li/TiS 2
0.1
1
Lithium Concentration in TiS 2
113
Fundamentals of Electrochemical Pseudocapacitors
FIGURE 3.4
Discharge curve for Li + intercalation into TiS 2 during electrode discharge. (Source: Conway, B.
E. and W. G. Pell. Journal of Solid State Electrochemistry, 7, 637–644. With permission.)
The intercalation occurs in the layer lattice sites of the cathode’s crystal
structure and it is subjected to diffusion limitations of lithium within the
lattice [2]. The chemical diffusion coefficient (D) relates Li flux to the concentration gradient, while the behavior for a dilute Li species is represented
as the jump diffusion coefficient (D j ) [25,26]. D J describes the collective statistical mobility for lithium ions diffusing through lattice sites by hopping
events. Monte Carlo simulation of the diffusion in TiS 2 crystal structure
illustrates that as Li concentration increases, the z-lattice parameter contracts and makes it harder for continued lithium diffusion (see Figure 3.6)
[25]. Therefore, the diffusion rate of Li inside the host material restricts
charge rates so that the corresponding ES could not be used in high power
demanding applications. The system may be more applicable for hybrid
battery/ES devices.
3.2.4 Pseudocapacitance Induced by Redox Couples
3.2.4.1 Pseudocapacitance Induced by Dissolved Couples
Pseudocapacitance can also be induced by a redox reaction in which both
the reductant and oxidant are dissolved in the electrolyte. For a reversible
redox reaction, the Nernst equation like Equations (3.1) and Equations (3.2)
to (3.6) are all applicable. In this case, Equation (3.6) can be alternatively
rewritten as