

t = 0 s
t = 0.2 s
10
11
12
13
14
15
16
17
18
Natural Logarithmic Maximum
Specific Power Density, W/kg
t = 5.0 s
0.00
0.05
0.10
0.15
0.20
0.25
0.30
0.35
Equivalent Series Resistance, Ω.cm 2
(a)
Natural Logarithmic Maximum
Specifi c Power Density, W/kg
17
16
15
14
13
12
11
10
t = 0 s
t = 0.2 s
t = 5.0 s
0
1000
2000
3000
4000
5000
6000
7000
Faradaic Leakage Resistance, Ω.cm 2
(b)
85
Fundamentals of Electrochemical Double-Layer Supercapacitors
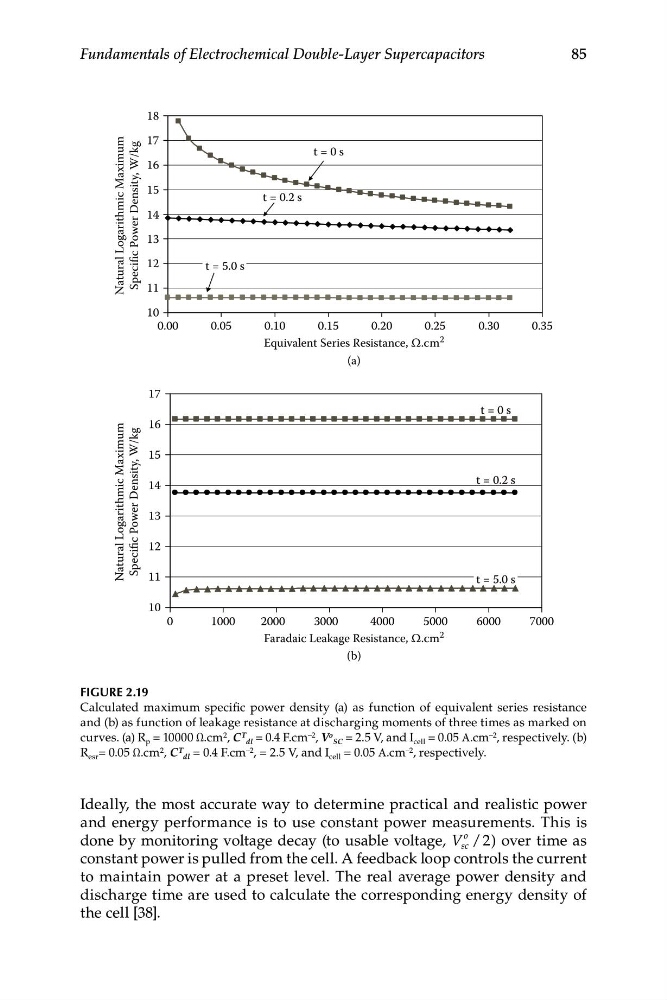
FIGURE 2.19
Calculated maximum specific power density (a) as function of equivalent series resistance
and (b) as function of leakage resistance at discharging moments of three times as marked on
curves. (a) R p = 10000 Ω.cm 2 , C T
dl = 0.4 F.cm –2 , V o
SC = 2.5 V, and I cell = 0.05 Α.cm –2 , respectively. (b)
R esr = 0.05 Ω.cm 2 , C T
dl = 0.4 F.cm –2 , = 2.5 V, and I cell = 0.05 Α.cm –2 , respectively.
Ideally, the most accurate way to determine practical and realistic power
and energy performance is to use constant power measurements. This is
done by monitoring voltage decay (to usable voltage, V sc
o / 2) over time as
constant power is pulled from the cell. A feedback loop controls the current
to maintain power at a preset level. The real average power density and
discharge time are used to calculate the corresponding energy density of
the cell [38].
t = 0.2 s
10
11
12
13
14
15
16
17
18
Natural Logarithmic Maximum
Specific Power Density, W/kg
t = 5.0 s
0.00
0.05
0.10
0.15
0.20
0.25
0.30
0.35
Equivalent Series Resistance, Ω.cm 2
(a)
Natural Logarithmic Maximum
Specifi c Power Density, W/kg
17
16
15
14
13
12
11
10
t = 0 s
t = 0.2 s
t = 5.0 s
0
1000
2000
3000
4000
5000
6000
7000
Faradaic Leakage Resistance, Ω.cm 2
(b)
85
Fundamentals of Electrochemical Double-Layer Supercapacitors
FIGURE 2.19
Calculated maximum specific power density (a) as function of equivalent series resistance
and (b) as function of leakage resistance at discharging moments of three times as marked on
curves. (a) R p = 10000 Ω.cm 2 , C T
dl = 0.4 F.cm –2 , V o
SC = 2.5 V, and I cell = 0.05 Α.cm –2 , respectively. (b)
R esr = 0.05 Ω.cm 2 , C T
dl = 0.4 F.cm –2 , = 2.5 V, and I cell = 0.05 Α.cm –2 , respectively.
Ideally, the most accurate way to determine practical and realistic power
and energy performance is to use constant power measurements. This is
done by monitoring voltage decay (to usable voltage, V sc
o / 2) over time as
constant power is pulled from the cell. A feedback loop controls the current
to maintain power at a preset level. The real average power density and
discharge time are used to calculate the corresponding energy density of
the cell [38].