

2 Direct Visualization of Crystal Formation and Growth …
31
such as mechanochromic behavior. Furthermore, this facile method may provide
practical opportunities and utilizations for other molecules employing fluorescence
microscopy and fluorescent materials.
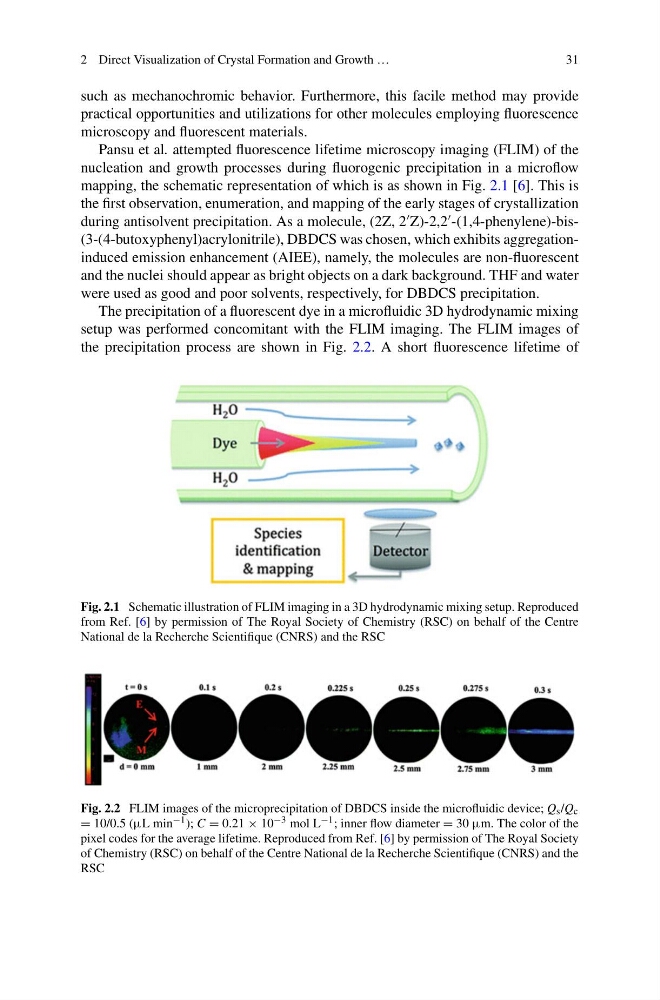
Pansu et al. attempted fluorescence lifetime microscopy imaging (FLIM) of the
nucleation and growth processes during fluorogenic precipitation in a microflow
mapping, the schematic representation of which is as shown in Fig. 2.1 [6]. This is
the first observation, enumeration, and mapping of the early stages of crystallization
during antisolvent precipitation. As a molecule, (2Z, 2
Z)-2,2
-(1,4-phenylene)-bis(3-(4-butoxyphenyl)acrylonitrile), DBDCS was chosen, which exhibits aggregationinduced emission enhancement (AIEE), namely, the molecules are non-fluorescent
and the nuclei should appear as bright objects on a dark background. THF and water
were used as good and poor solvents, respectively, for DBDCS precipitation.
The precipitation of a fluorescent dye in a microfluidic 3D hydrodynamic mixing
setup was performed concomitant with the FLIM imaging. The FLIM images of
the precipitation process are shown in Fig. 2.2. A short fluorescence lifetime of
Fig. 2.1 Schematic illustration of FLIM imaging in a 3D hydrodynamic mixing setup. Reproduced
from Ref. [6] by permission of The Royal Society of Chemistry (RSC) on behalf of the Centre
National de la Recherche Scientifique (CNRS) and the RSC
Fig. 2.2 FLIM images of the microprecipitation of DBDCS inside the microfluidic device; Q s /Q c
= 10/0.5 (μL min −1 ); C = 0.21 × 10 −3 mol L −1 ; inner flow diameter = 30 μm. The color of the
pixel codes for the average lifetime. Reproduced from Ref. [6] by permission of The Royal Society
of Chemistry (RSC) on behalf of the Centre National de la Recherche Scientifique (CNRS) and the
RSC
31
such as mechanochromic behavior. Furthermore, this facile method may provide
practical opportunities and utilizations for other molecules employing fluorescence
microscopy and fluorescent materials.
Pansu et al. attempted fluorescence lifetime microscopy imaging (FLIM) of the
nucleation and growth processes during fluorogenic precipitation in a microflow
mapping, the schematic representation of which is as shown in Fig. 2.1 [6]. This is
the first observation, enumeration, and mapping of the early stages of crystallization
during antisolvent precipitation. As a molecule, (2Z, 2
Z)-2,2
-(1,4-phenylene)-bis(3-(4-butoxyphenyl)acrylonitrile), DBDCS was chosen, which exhibits aggregationinduced emission enhancement (AIEE), namely, the molecules are non-fluorescent
and the nuclei should appear as bright objects on a dark background. THF and water
were used as good and poor solvents, respectively, for DBDCS precipitation.
The precipitation of a fluorescent dye in a microfluidic 3D hydrodynamic mixing
setup was performed concomitant with the FLIM imaging. The FLIM images of
the precipitation process are shown in Fig. 2.2. A short fluorescence lifetime of
Fig. 2.1 Schematic illustration of FLIM imaging in a 3D hydrodynamic mixing setup. Reproduced
from Ref. [6] by permission of The Royal Society of Chemistry (RSC) on behalf of the Centre
National de la Recherche Scientifique (CNRS) and the RSC
Fig. 2.2 FLIM images of the microprecipitation of DBDCS inside the microfluidic device; Q s /Q c
= 10/0.5 (μL min −1 ); C = 0.21 × 10 −3 mol L −1 ; inner flow diameter = 30 μm. The color of the
pixel codes for the average lifetime. Reproduced from Ref. [6] by permission of The Royal Society
of Chemistry (RSC) on behalf of the Centre National de la Recherche Scientifique (CNRS) and the
RSC