

24
K. D. M. Harris et al.
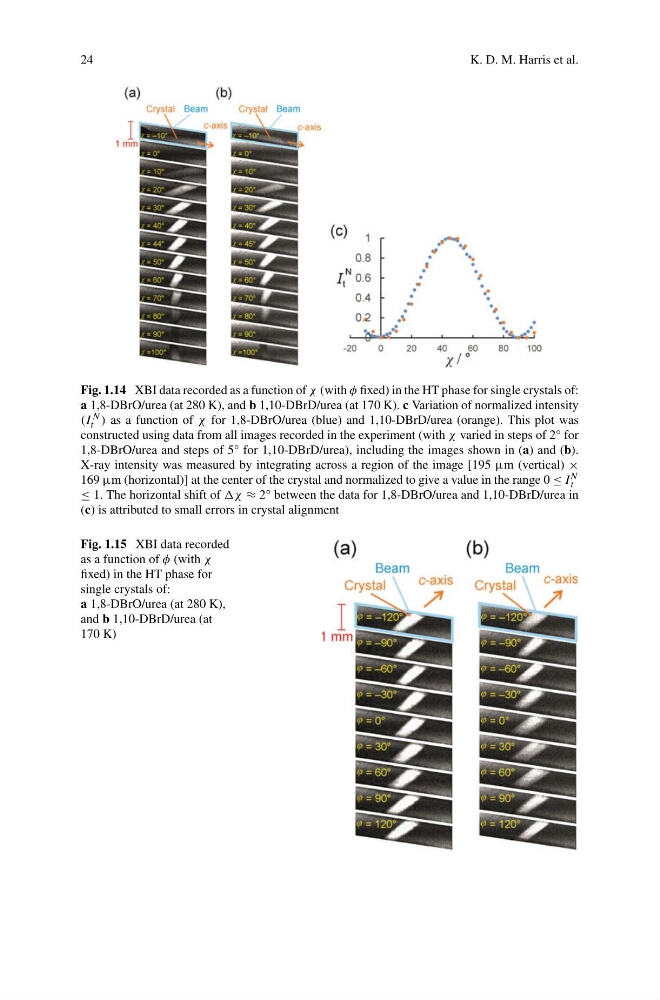
Fig. 1.14 XBI data recorded as a function of χ (with φ fixed) in the HT phase for single crystals of:
a 1,8-DBrO/urea (at 280 K), and b 1,10-DBrD/urea (at 170 K). c Variation of normalized intensity
(I N
t ) as a function of χ for 1,8-DBrO/urea (blue) and 1,10-DBrD/urea (orange). This plot was
constructed using data from all images recorded in the experiment (with χ varied in steps of 2° for
1,8-DBrO/urea and steps of 5° for 1,10-DBrD/urea), including the images shown in (a) and (b).
X-ray intensity was measured by integrating across a region of the image [195 μm (vertical) ×
169 μm (horizontal)] at the center of the crystal and normalized to give a value in the range 0 ≤ I N
t
≤ 1. The horizontal shift of χ ≈ 2° between the data for 1,8-DBrO/urea and 1,10-DBrD/urea in
(c) is attributed to small errors in crystal alignment
Fig. 1.15 XBI data recorded
as a function of φ (with χ
fixed) in the HT phase for
single crystals of:
a 1,8-DBrO/urea (at 280 K),
and b 1,10-DBrD/urea (at
170 K)
K. D. M. Harris et al.
Fig. 1.14 XBI data recorded as a function of χ (with φ fixed) in the HT phase for single crystals of:
a 1,8-DBrO/urea (at 280 K), and b 1,10-DBrD/urea (at 170 K). c Variation of normalized intensity
(I N
t ) as a function of χ for 1,8-DBrO/urea (blue) and 1,10-DBrD/urea (orange). This plot was
constructed using data from all images recorded in the experiment (with χ varied in steps of 2° for
1,8-DBrO/urea and steps of 5° for 1,10-DBrD/urea), including the images shown in (a) and (b).
X-ray intensity was measured by integrating across a region of the image [195 μm (vertical) ×
169 μm (horizontal)] at the center of the crystal and normalized to give a value in the range 0 ≤ I N
t
≤ 1. The horizontal shift of χ ≈ 2° between the data for 1,8-DBrO/urea and 1,10-DBrD/urea in
(c) is attributed to small errors in crystal alignment
Fig. 1.15 XBI data recorded
as a function of φ (with χ
fixed) in the HT phase for
single crystals of:
a 1,8-DBrO/urea (at 280 K),
and b 1,10-DBrD/urea (at
170 K)