

warmer and wetter conditions prevail. These simultaneous variations in climate,
often of opposite sign, over distant parts of the globe are commonly referred to as
“teleconnections” (Wallace and Gutzler 1981; Esbensen 1984; Barnston and
Livezey 1987; Kushnir and Wallace 1989; Trenberth et al. 1998). Statistically
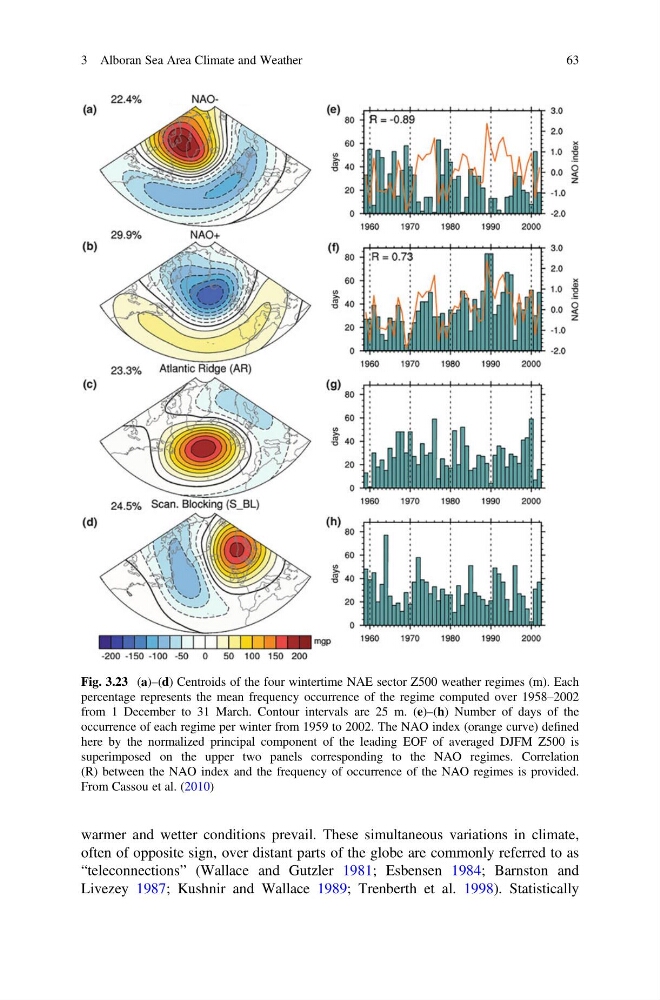
Fig. 3.23 (a)–(d) Centroids of the four wintertime NAE sector Z500 weather regimes (m). Each
percentage represents the mean frequency occurrence of the regime computed over 1958–2002
from 1 December to 31 March. Contour intervals are 25 m. (e)–(h) Number of days of the
occurrence of each regime per winter from 1959 to 2002. The NAO index (orange curve) defined
here by the normalized principal component of the leading EOF of averaged DJFM Z500 is
superimposed on the upper two panels corresponding to the NAO regimes. Correlation
(R) between the NAO index and the frequency of occurrence of the NAO regimes is provided.
From Cassou et al. (2010)
3 Alboran Sea Area Climate and Weather
63
often of opposite sign, over distant parts of the globe are commonly referred to as
“teleconnections” (Wallace and Gutzler 1981; Esbensen 1984; Barnston and
Livezey 1987; Kushnir and Wallace 1989; Trenberth et al. 1998). Statistically
Fig. 3.23 (a)–(d) Centroids of the four wintertime NAE sector Z500 weather regimes (m). Each
percentage represents the mean frequency occurrence of the regime computed over 1958–2002
from 1 December to 31 March. Contour intervals are 25 m. (e)–(h) Number of days of the
occurrence of each regime per winter from 1959 to 2002. The NAO index (orange curve) defined
here by the normalized principal component of the leading EOF of averaged DJFM Z500 is
superimposed on the upper two panels corresponding to the NAO regimes. Correlation
(R) between the NAO index and the frequency of occurrence of the NAO regimes is provided.
From Cassou et al. (2010)
3 Alboran Sea Area Climate and Weather
63