

eastward progression of Rossby waves in the upper-level flow: (1) weakened zonal
winds, and (2) increased wave amplitude. These effects are particularly evident in
autumn and winter consistent with sea ice loss, but are also apparent in summer,
possibly related to earlier snowmelt on high-latitude land. Slower progression of
upper-level waves would cause associated weather patterns in midlatitudes to be
more persistent, which may lead to an increased probability of extreme weather
events that result from prolonged conditions, such as drought, flooding, cold spells,
and heat waves. Grassi et al. (2013) have associated an increase in the occurrence
and intensity of extreme cold events, over continental Europe, and extreme precipitation events, over the entire Mediterranean Basin, was with loss of Arctic sea ice. In
70°N
30°N
10°S
50°S
90°S
180°
140°W
100°W
60°W
20°W
20°E
60°E
100°E
140°E
70°N
30°N
10°S
50°S
90°S
180°
5
1 5
2 5
3 5
4 5
5 5
140°W
100°W
60°W
20°W
20°E
60°E
100°E
140°E
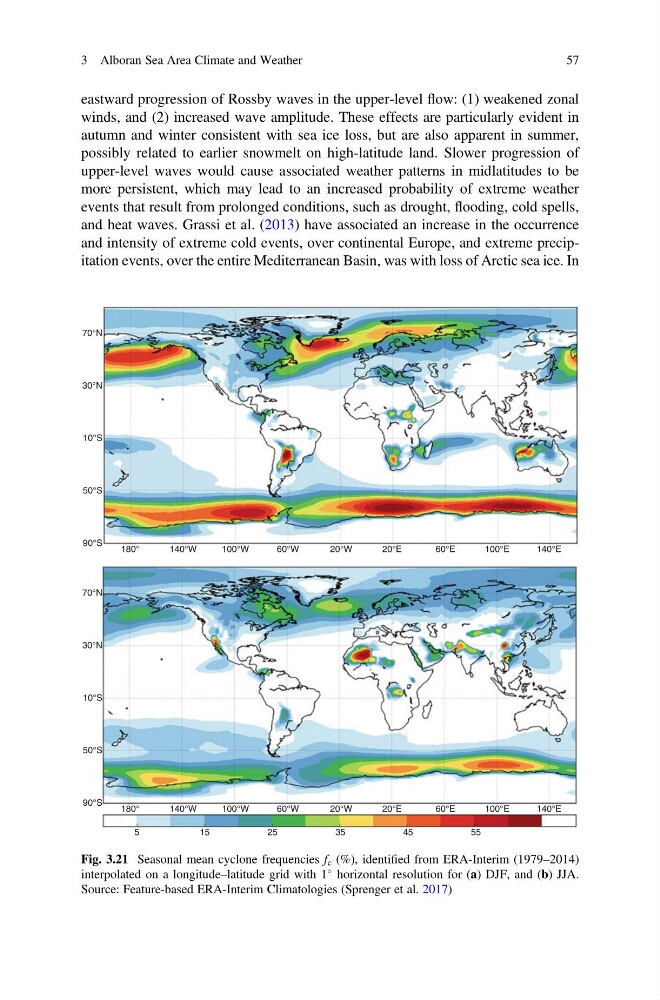
Fig. 3.21 Seasonal mean cyclone frequencies f c (%), identified from ERA-Interim (1979–2014)
interpolated on a longitude–latitude grid with 1
horizontal resolution for (a) DJF, and (b) JJA.
Source: Feature-based ERA-Interim Climatologies (Sprenger et al. 2017)
3 Alboran Sea Area Climate and Weather
57
winds, and (2) increased wave amplitude. These effects are particularly evident in
autumn and winter consistent with sea ice loss, but are also apparent in summer,
possibly related to earlier snowmelt on high-latitude land. Slower progression of
upper-level waves would cause associated weather patterns in midlatitudes to be
more persistent, which may lead to an increased probability of extreme weather
events that result from prolonged conditions, such as drought, flooding, cold spells,
and heat waves. Grassi et al. (2013) have associated an increase in the occurrence
and intensity of extreme cold events, over continental Europe, and extreme precipitation events, over the entire Mediterranean Basin, was with loss of Arctic sea ice. In
70°N
30°N
10°S
50°S
90°S
180°
140°W
100°W
60°W
20°W
20°E
60°E
100°E
140°E
70°N
30°N
10°S
50°S
90°S
180°
5
1 5
2 5
3 5
4 5
5 5
140°W
100°W
60°W
20°W
20°E
60°E
100°E
140°E
Fig. 3.21 Seasonal mean cyclone frequencies f c (%), identified from ERA-Interim (1979–2014)
interpolated on a longitude–latitude grid with 1
horizontal resolution for (a) DJF, and (b) JJA.
Source: Feature-based ERA-Interim Climatologies (Sprenger et al. 2017)
3 Alboran Sea Area Climate and Weather
57