

it can be modeled through an autoregressive process of nonseasonal order p and
seasonal order P (Gutiérrez-Estrada et al. 2020). Likewise, all simulations are
developed in a spatially implicit context.
Like other computer programs, SFish allows to assess the variation of abundance
or biomass during the exploitation period. However SFish is specifically designed to
disaggregate the environmental effects of the fishing component. If it is assumed that
throughout the simulation the environmental conditions remain similar to those
found in the period in which the growth model was obtained (i.e., if the model
does not incorporate extra-compensatory effects), then the variation in biomass at
time t + 1 depends exclusively on the biomass and the catch made at time t, and
therefore the biomass series over time can be adjusted to an autoregressive process.
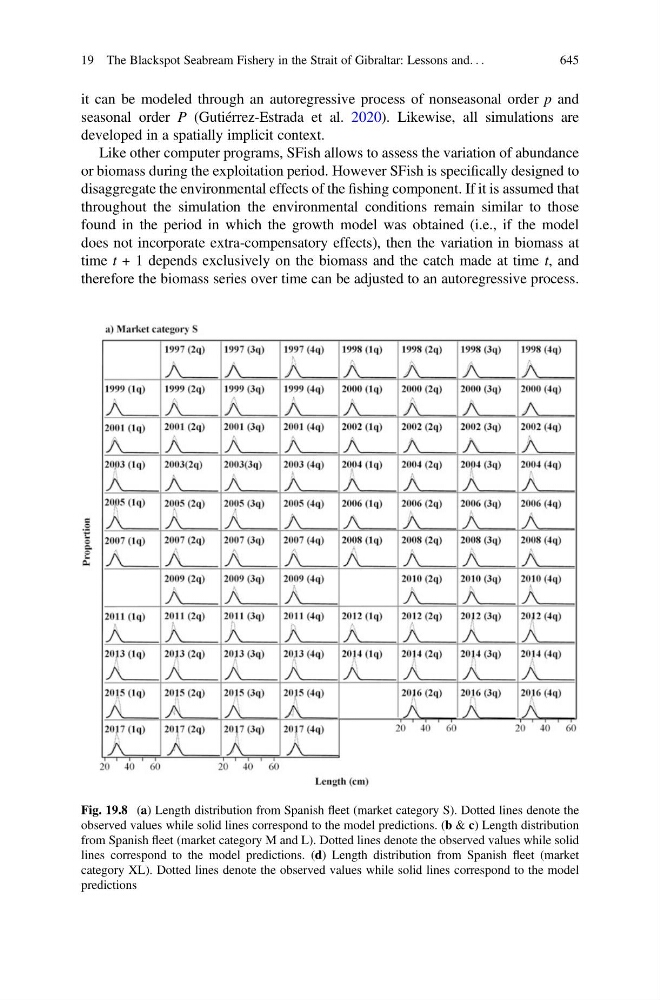
Fig. 19.8 (a) Length distribution from Spanish fleet (market category S). Dotted lines denote the
observed values while solid lines correspond to the model predictions. (b & c) Length distribution
from Spanish fleet (market category M and L). Dotted lines denote the observed values while solid
lines correspond to the model predictions. (d) Length distribution from Spanish fleet (market
category XL). Dotted lines denote the observed values while solid lines correspond to the model
predictions
19 The Blackspot Seabream Fishery in the Strait of Gibraltar: Lessons and. . .
645