

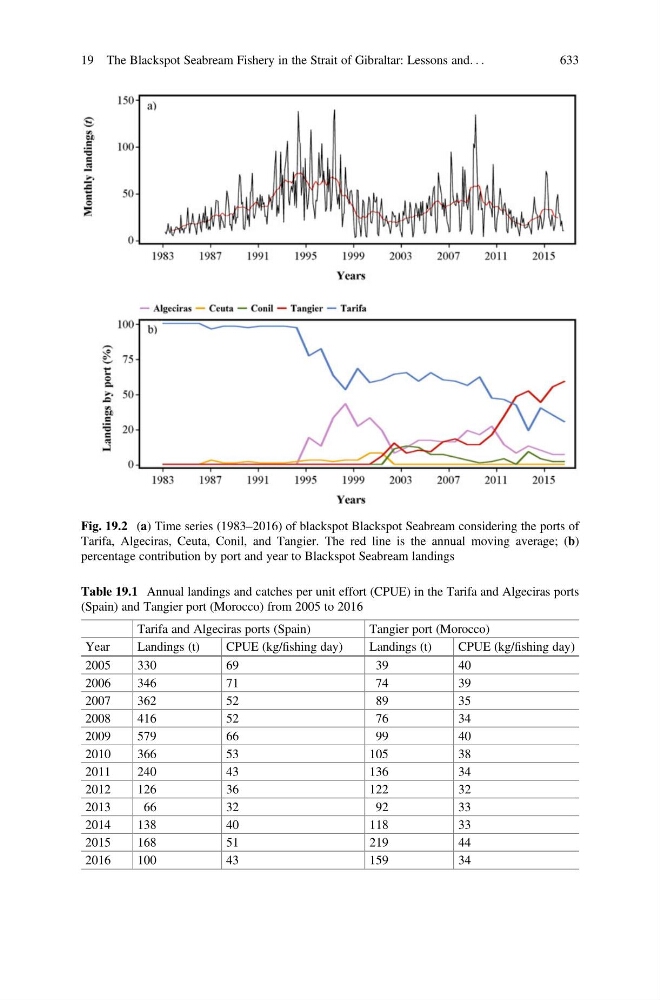
Fig. 19.2 (a) Time series (1983–2016) of blackspot Blackspot Seabream considering the ports of
Tarifa, Algeciras, Ceuta, Conil, and Tangier. The red line is the annual moving average; (b)
percentage contribution by port and year to Blackspot Seabream landings
Table 19.1 Annual landings and catches per unit effort (CPUE) in the Tarifa and Algeciras ports
(Spain) and Tangier port (Morocco) from 2005 to 2016
Tarifa and Algeciras ports (Spain)
Tangier port (Morocco)
Year
Landings (t)
CPUE (kg/fishing day)
Landings (t)
CPUE (kg/fishing day)
2005
330
69
39
40
2006
346
71
74
39
2007
362
52
89
35
2008
416
52
76
34
2009
579
66
99
40
2010
366
53
105
38
2011
240
43
136
34
2012
126
36
122
32
2013
66
32
92
33
2014
138
40
118
33
2015
168
51
219
44
2016
100
43
159
34
19 The Blackspot Seabream Fishery in the Strait of Gibraltar: Lessons and. . .
633