

silicate (Gil and Gomis 1994; Rubín et al. 1992, 1997; Cano et al. 1997). Other
studies have reported also low concentrations in areas of the continental margin of
the NW Alboran Sea during the stratification period, with nitrate and sometimes
phosphate below their detection limit above the thermocline, while silicate concentrations remained above 0.8 μM (Ramírez et al. 2005; Ramírez 2007). Likewise, very
low nutrient concentrations have also been found usually in adjacent areas north and
east of the EAG due to the presence of warmer, saltier, and nutrient-poor MSW
coming from the Algero-Balear basin. In the Mediterranean waters adjacent to the
Almeria-Oran front phosphate concentrations in the upper 20 m are frequently below
the detection limit (Jacquet et al. 2002; Leblanc et al. 2004), while nitrate and silicate
are low but detectable with the lower concentrations around 0.03–0.06 μM and
0.8 μM, respectively (Leblanc et al. 2004). In contrast, the highest nutrient concentrations in the Alboran Sea are usually found at the vicinities of the Strait of Gibraltar
and along the NW sector of the Spanish continental margin, where intense upwelling
induced by different mechanisms takes place very frequently throughout the year
(Minas et al. 1991; Baldacci et al. 2001; Renault et al. 2012). Thus, at the eastern side
of the Strait of Gibraltar nitrate concentrations as high as ~5.0 μM have been found
in the Atlantic waters, while phosphate concentration can reach values around
~0.30 μM and silicate up to ~3.0 μM (Gómez et al. 2000; Dafner et al. 2003;
Huertas et al. 2012). Nevertheless, the variability at the Strait is very high and
other authors have reported lower concentrations (e.g., Gómez et al. 2001;
Echevarría et al. 2002; Ramírez-Romero et al. 2014). The variability of nutrients
in this area depends on the tidal cycle, water exchange, stratification of the water
column, the occurrence of mixing events, the incursions of NACW, and the wind
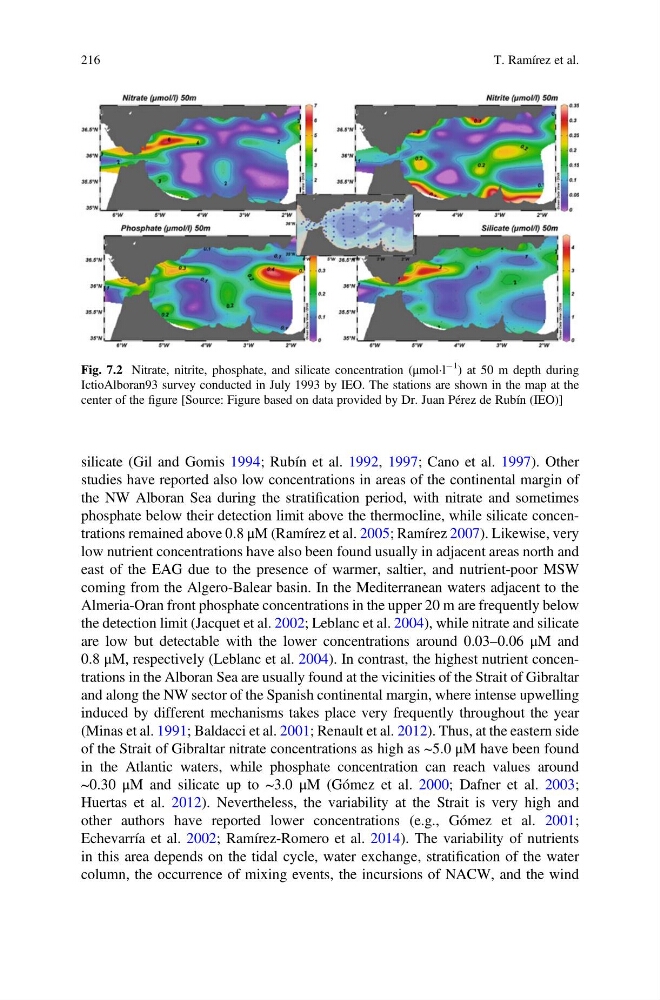
Fig. 7.2 Nitrate, nitrite, phosphate, and silicate concentration (μmolÁl
À1
) at 50 m depth during
IctioAlboran93 survey conducted in July 1993 by IEO. The stations are shown in the map at the
center of the figure [Source: Figure based on data provided by Dr. Juan Pérez de Rubín (IEO)]
216
T. Ramírez et al.
studies have reported also low concentrations in areas of the continental margin of
the NW Alboran Sea during the stratification period, with nitrate and sometimes
phosphate below their detection limit above the thermocline, while silicate concentrations remained above 0.8 μM (Ramírez et al. 2005; Ramírez 2007). Likewise, very
low nutrient concentrations have also been found usually in adjacent areas north and
east of the EAG due to the presence of warmer, saltier, and nutrient-poor MSW
coming from the Algero-Balear basin. In the Mediterranean waters adjacent to the
Almeria-Oran front phosphate concentrations in the upper 20 m are frequently below
the detection limit (Jacquet et al. 2002; Leblanc et al. 2004), while nitrate and silicate
are low but detectable with the lower concentrations around 0.03–0.06 μM and
0.8 μM, respectively (Leblanc et al. 2004). In contrast, the highest nutrient concentrations in the Alboran Sea are usually found at the vicinities of the Strait of Gibraltar
and along the NW sector of the Spanish continental margin, where intense upwelling
induced by different mechanisms takes place very frequently throughout the year
(Minas et al. 1991; Baldacci et al. 2001; Renault et al. 2012). Thus, at the eastern side
of the Strait of Gibraltar nitrate concentrations as high as ~5.0 μM have been found
in the Atlantic waters, while phosphate concentration can reach values around
~0.30 μM and silicate up to ~3.0 μM (Gómez et al. 2000; Dafner et al. 2003;
Huertas et al. 2012). Nevertheless, the variability at the Strait is very high and
other authors have reported lower concentrations (e.g., Gómez et al. 2001;
Echevarría et al. 2002; Ramírez-Romero et al. 2014). The variability of nutrients
in this area depends on the tidal cycle, water exchange, stratification of the water
column, the occurrence of mixing events, the incursions of NACW, and the wind
Fig. 7.2 Nitrate, nitrite, phosphate, and silicate concentration (μmolÁl
À1
) at 50 m depth during
IctioAlboran93 survey conducted in July 1993 by IEO. The stations are shown in the map at the
center of the figure [Source: Figure based on data provided by Dr. Juan Pérez de Rubín (IEO)]
216
T. Ramírez et al.