

Current measurements in the Alboran Sea (Fabres et al. 2002) show a westward
current at 470 and 974 m depth at the northwestern sector of the Alboran Sea
(4
15.4
0 W, 36
14.4
0 W). The average velocity in this case was between 3.7 and
5 cm/s, with peaks of 22 cm/s close to the sea bottom. Sánchez-Vidal et al. (2005)
analyzed three lines of current meters at a section at the eastern limit of the Alboran
Sea (1
30 W). These lines were located at 36
40.5
0 N, 36
13.1
0 N and 35
55.5
0 N.
At 680 and 645 m depth, the average current was directed to the SE in the northern
and central lines. The deep current meters at 1190 m at the northern line and at 1170
and 2210 m at the central line also showed a SE average direction. The average
velocities ranged between 2 and 4 cm/s. Currents at 510, 1050 and 2070 m at the
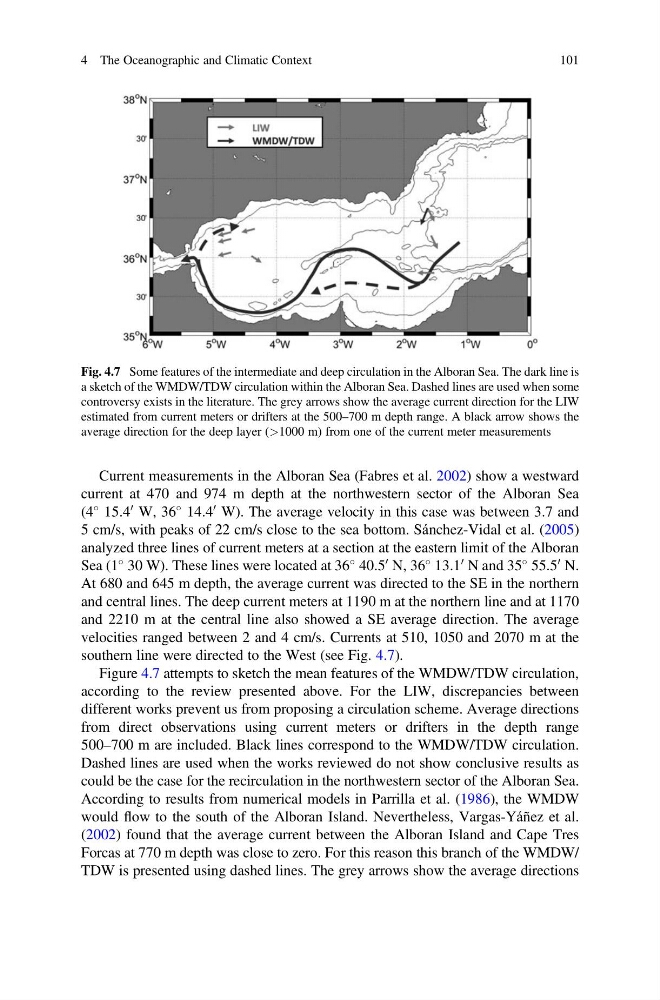
southern line were directed to the West (see Fig. 4.7).
Figure 4.7 attempts to sketch the mean features of the WMDW/TDW circulation,
according to the review presented above. For the LIW, discrepancies between
different works prevent us from proposing a circulation scheme. Average directions
from direct observations using current meters or drifters in the depth range
500–700 m are included. Black lines correspond to the WMDW/TDW circulation.
Dashed lines are used when the works reviewed do not show conclusive results as
could be the case for the recirculation in the northwestern sector of the Alboran Sea.
According to results from numerical models in Parrilla et al. (1986), the WMDW
would flow to the south of the Alboran Island. Nevertheless, Vargas-Yáñez et al.
(2002) found that the average current between the Alboran Island and Cape Tres
Forcas at 770 m depth was close to zero. For this reason this branch of the WMDW/
TDW is presented using dashed lines. The grey arrows show the average directions
Fig. 4.7 Some features of the intermediate and deep circulation in the Alboran Sea. The dark line is
a sketch of the WMDW/TDW circulation within the Alboran Sea. Dashed lines are used when some
controversy exists in the literature. The grey arrows show the average current direction for the LIW
estimated from current meters or drifters at the 500–700 m depth range. A black arrow shows the
average direction for the deep layer (>1000 m) from one of the current meter measurements
4 The Oceanographic and Climatic Context
101
current at 470 and 974 m depth at the northwestern sector of the Alboran Sea
(4
15.4
0 W, 36
14.4
0 W). The average velocity in this case was between 3.7 and
5 cm/s, with peaks of 22 cm/s close to the sea bottom. Sánchez-Vidal et al. (2005)
analyzed three lines of current meters at a section at the eastern limit of the Alboran
Sea (1
30 W). These lines were located at 36
40.5
0 N, 36
13.1
0 N and 35
55.5
0 N.
At 680 and 645 m depth, the average current was directed to the SE in the northern
and central lines. The deep current meters at 1190 m at the northern line and at 1170
and 2210 m at the central line also showed a SE average direction. The average
velocities ranged between 2 and 4 cm/s. Currents at 510, 1050 and 2070 m at the
southern line were directed to the West (see Fig. 4.7).
Figure 4.7 attempts to sketch the mean features of the WMDW/TDW circulation,
according to the review presented above. For the LIW, discrepancies between
different works prevent us from proposing a circulation scheme. Average directions
from direct observations using current meters or drifters in the depth range
500–700 m are included. Black lines correspond to the WMDW/TDW circulation.
Dashed lines are used when the works reviewed do not show conclusive results as
could be the case for the recirculation in the northwestern sector of the Alboran Sea.
According to results from numerical models in Parrilla et al. (1986), the WMDW
would flow to the south of the Alboran Island. Nevertheless, Vargas-Yáñez et al.
(2002) found that the average current between the Alboran Island and Cape Tres
Forcas at 770 m depth was close to zero. For this reason this branch of the WMDW/
TDW is presented using dashed lines. The grey arrows show the average directions
Fig. 4.7 Some features of the intermediate and deep circulation in the Alboran Sea. The dark line is
a sketch of the WMDW/TDW circulation within the Alboran Sea. Dashed lines are used when some
controversy exists in the literature. The grey arrows show the average current direction for the LIW
estimated from current meters or drifters at the 500–700 m depth range. A black arrow shows the
average direction for the deep layer (>1000 m) from one of the current meter measurements
4 The Oceanographic and Climatic Context
101