

campaign has been chosen because it covers the whole Alboran Sea, with stations
extending from 5.2
W to 0.13
W, and the main features of its circulation were
clearly observable during the time of that cruise.
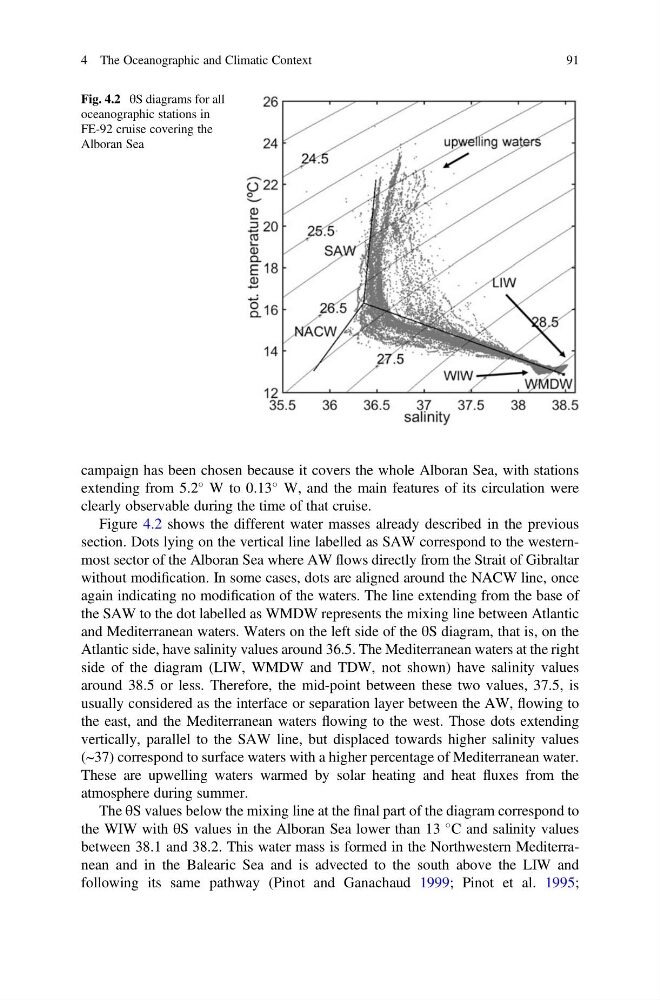
Figure 4.2 shows the different water masses already described in the previous
section. Dots lying on the vertical line labelled as SAW correspond to the westernmost sector of the Alboran Sea where AW flows directly from the Strait of Gibraltar
without modification. In some cases, dots are aligned around the NACW line, once
again indicating no modification of the waters. The line extending from the base of
the SAW to the dot labelled as WMDW represents the mixing line between Atlantic
and Mediterranean waters. Waters on the left side of the θS diagram, that is, on the
Atlantic side, have salinity values around 36.5. The Mediterranean waters at the right
side of the diagram (LIW, WMDW and TDW, not shown) have salinity values
around 38.5 or less. Therefore, the mid-point between these two values, 37.5, is
usually considered as the interface or separation layer between the AW, flowing to
the east, and the Mediterranean waters flowing to the west. Those dots extending
vertically, parallel to the SAW line, but displaced towards higher salinity values
(~37) correspond to surface waters with a higher percentage of Mediterranean water.
These are upwelling waters warmed by solar heating and heat fluxes from the
atmosphere during summer.
The θS values below the mixing line at the final part of the diagram correspond to
the WIW with θS values in the Alboran Sea lower than 13
C and salinity values
between 38.1 and 38.2. This water mass is formed in the Northwestern Mediterranean and in the Balearic Sea and is advected to the south above the LIW and
following its same pathway (Pinot and Ganachaud 1999; Pinot et al. 1995;
Fig. 4.2 θS diagrams for all
oceanographic stations in
FE-92 cruise covering the
Alboran Sea
4 The Oceanographic and Climatic Context
91
extending from 5.2
W to 0.13
W, and the main features of its circulation were
clearly observable during the time of that cruise.
Figure 4.2 shows the different water masses already described in the previous
section. Dots lying on the vertical line labelled as SAW correspond to the westernmost sector of the Alboran Sea where AW flows directly from the Strait of Gibraltar
without modification. In some cases, dots are aligned around the NACW line, once
again indicating no modification of the waters. The line extending from the base of
the SAW to the dot labelled as WMDW represents the mixing line between Atlantic
and Mediterranean waters. Waters on the left side of the θS diagram, that is, on the
Atlantic side, have salinity values around 36.5. The Mediterranean waters at the right
side of the diagram (LIW, WMDW and TDW, not shown) have salinity values
around 38.5 or less. Therefore, the mid-point between these two values, 37.5, is
usually considered as the interface or separation layer between the AW, flowing to
the east, and the Mediterranean waters flowing to the west. Those dots extending
vertically, parallel to the SAW line, but displaced towards higher salinity values
(~37) correspond to surface waters with a higher percentage of Mediterranean water.
These are upwelling waters warmed by solar heating and heat fluxes from the
atmosphere during summer.
The θS values below the mixing line at the final part of the diagram correspond to
the WIW with θS values in the Alboran Sea lower than 13
C and salinity values
between 38.1 and 38.2. This water mass is formed in the Northwestern Mediterranean and in the Balearic Sea and is advected to the south above the LIW and
following its same pathway (Pinot and Ganachaud 1999; Pinot et al. 1995;
Fig. 4.2 θS diagrams for all
oceanographic stations in
FE-92 cruise covering the
Alboran Sea
4 The Oceanographic and Climatic Context
91