

72
2 – Methods and techniques
Table 18 – Log σT as a function of 1/T.
T [°C]
102
200
298
398
490
589
666
741
R [Ω]
0.1082 0.06938 0.05614 0.04954 0.04578 0.04357 0.04219 0.04125
T [K]
375
473
571
671
763
862
939
1 014
10
3
/T [K
−1
]
2.67
2.11
1.75
1.49
1.31
1.16
1.07
0.946
σ [S cm
−1
]
70.15 109.4
135.2
153.2
165.8
174.2
180.3
184.0
σT [S cm
−1
K] 26 306 51 746 77 199 102 797 126 505 150 160 169 302 186 576
log σT
4.42
4.714
4.888
5.012
5.102
5.176
5.23
5.271
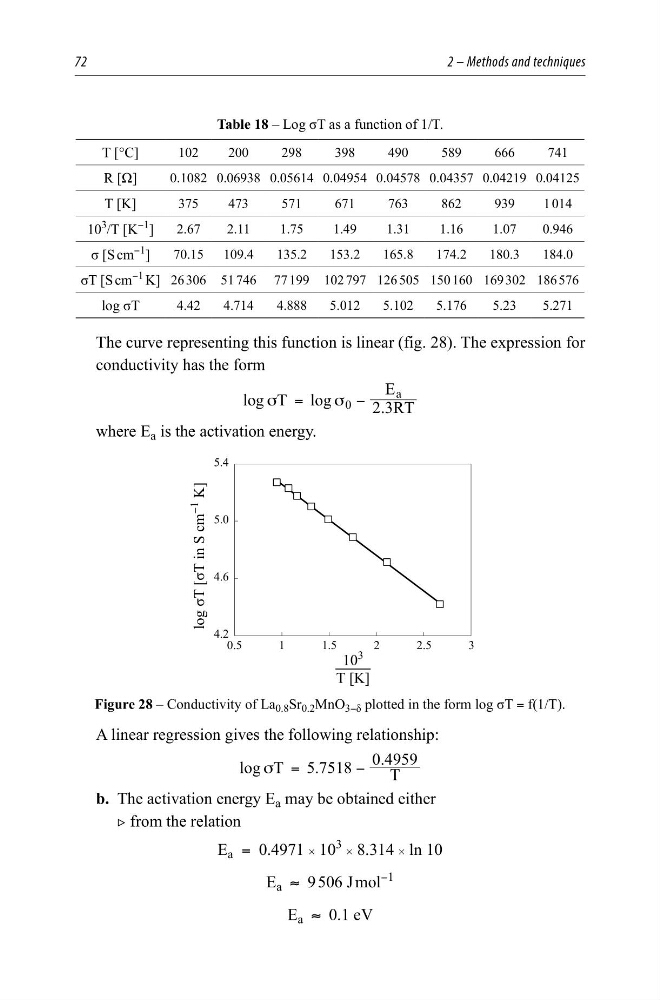
The curve representing this function is linear (fig. 28). The expression for
conductivity has the form
log T log
2.3RT
E
0
a
σ
σ
=
−
where E a is the activation energy.
—
7>.@
ORJı7>ı7LQ6FP
<
.@
Figure 28 – Conductivity of La 0.8 Sr 0.2 MnO 3−δ plotted in the form log σT = f(1/T).
A linear regression gives the following relationship:
log T 5.7518
T
0.4959
σ =
−
b. The activation energy E a may be obtained either
2 from the relation
E a = 0.4971 # 10
3 # 8.314 # ln 10
E a ≈ 9 506 J mol
−1
E a ≈ 0.1 eV
2 – Methods and techniques
Table 18 – Log σT as a function of 1/T.
T [°C]
102
200
298
398
490
589
666
741
R [Ω]
0.1082 0.06938 0.05614 0.04954 0.04578 0.04357 0.04219 0.04125
T [K]
375
473
571
671
763
862
939
1 014
10
3
/T [K
−1
]
2.67
2.11
1.75
1.49
1.31
1.16
1.07
0.946
σ [S cm
−1
]
70.15 109.4
135.2
153.2
165.8
174.2
180.3
184.0
σT [S cm
−1
K] 26 306 51 746 77 199 102 797 126 505 150 160 169 302 186 576
log σT
4.42
4.714
4.888
5.012
5.102
5.176
5.23
5.271
The curve representing this function is linear (fig. 28). The expression for
conductivity has the form
log T log
2.3RT
E
0
a
σ
σ
=
−
where E a is the activation energy.
—
7>.@
ORJı7>ı7LQ6FP
<
.@
Figure 28 – Conductivity of La 0.8 Sr 0.2 MnO 3−δ plotted in the form log σT = f(1/T).
A linear regression gives the following relationship:
log T 5.7518
T
0.4959
σ =
−
b. The activation energy E a may be obtained either
2 from the relation
E a = 0.4971 # 10
3 # 8.314 # ln 10
E a ≈ 9 506 J mol
−1
E a ≈ 0.1 eV