

224
5 – Applications
3. a. Derive the expression for the emf ΔE T at the sensor terminals as a function
of the chemical potentials of the active species and of the CO 2 partial
pressure.
b. Show that we can write it in the form
∆E T = ΔE ° T + f (T, ln P CO 2 )
and relate ΔE ° T to the standard free enthalpy Δ r G ° T of the overall reaction.
4. The standard free enthalpy Δ r G ° T as a function of absolute temperature T of
the overall reaction is
Δ r G ° T = − 72 939 + 149.2 T
[J mol
−1
]
a. Using this relationship, derive the relationship ΔE ° T = f (T).
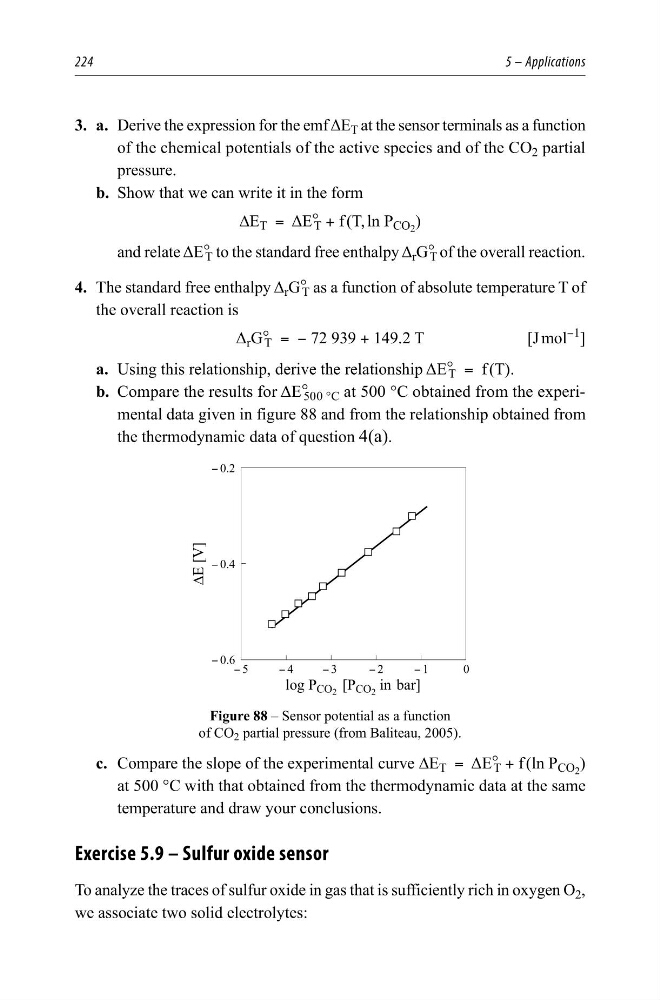
b. Compare the results for ΔE ° 500 °C at 500 °C obtained from the experimental data given in figure 88 and from the relationship obtained from
the thermodynamic data of question 4(a).
<
<
<
<
<
<
<
<
¨(>9@
ORJ3 &2 >3 &2 LQ EDU@
Figure 88 – Sensor potential as a function
of CO 2 partial pressure (from Baliteau, 2005).
c. Compare the slope of the experimental curve ∆E T = ΔE ° T + f (ln P CO 2 )
at 500 °C with that obtained from the thermodynamic data at the same
temperature and draw your conclusions.
Exercise 5.9 – Sulfur oxide sensor
To analyze the traces of sulfur oxide in gas that is sufficiently rich in oxygen O 2 ,
we associate two solid electrolytes:
5 – Applications
3. a. Derive the expression for the emf ΔE T at the sensor terminals as a function
of the chemical potentials of the active species and of the CO 2 partial
pressure.
b. Show that we can write it in the form
∆E T = ΔE ° T + f (T, ln P CO 2 )
and relate ΔE ° T to the standard free enthalpy Δ r G ° T of the overall reaction.
4. The standard free enthalpy Δ r G ° T as a function of absolute temperature T of
the overall reaction is
Δ r G ° T = − 72 939 + 149.2 T
[J mol
−1
]
a. Using this relationship, derive the relationship ΔE ° T = f (T).
b. Compare the results for ΔE ° 500 °C at 500 °C obtained from the experimental data given in figure 88 and from the relationship obtained from
the thermodynamic data of question 4(a).
<
<
<
<
<
<
<
<
¨(>9@
ORJ3 &2 >3 &2 LQ EDU@
Figure 88 – Sensor potential as a function
of CO 2 partial pressure (from Baliteau, 2005).
c. Compare the slope of the experimental curve ∆E T = ΔE ° T + f (ln P CO 2 )
at 500 °C with that obtained from the thermodynamic data at the same
temperature and draw your conclusions.
Exercise 5.9 – Sulfur oxide sensor
To analyze the traces of sulfur oxide in gas that is sufficiently rich in oxygen O 2 ,
we associate two solid electrolytes: