

218
5 – Applications
Table 47 – Insertion rate of lithium
into TiS 2 as a function of potential at 298 K.
x
0.01 0.1
0.2
0.3
0.4
0.5
0.6
0.7
0.8
0.9 0.99
emf [V] 2.49 2.4 2.36 2.31 2.26 2.215 2.18 2.13 2.07 1.99 1.86
By using the thermodynamic model
ln
E
E
F
RT x
x
x
°
Li
m
=
−
−
where x is the charge rate and x m is the maximum charge rate (x m = 1),
2 give the conditions for which this equation may be derived,
2 express the potential of a TiS 2 electrode as a function of the discharge
rate x,
2 based on the results given in table 47 and on the thermodynamic
model, plot the experimental curve for the open-circuit emf as a function of the insertion rate x. Discuss any similarities between the two.
c. To better understand the experimental data, we add to the model a thermodynamic energy term E int for the interaction between lithium ions.
The model then takes the form
ln
E
E
F
RT
x
x
x
z F
E
x
x
°
int
Li
m
m
=
−
− −
where z is the number of nearest neighbors of Li
+
(z = 6).
2 Determine the new equation.
2 Determine the value for E int that leads to the best agreement with experimental data and represent the situation graphically. Discuss any
agreement between the experimental points and the theory.
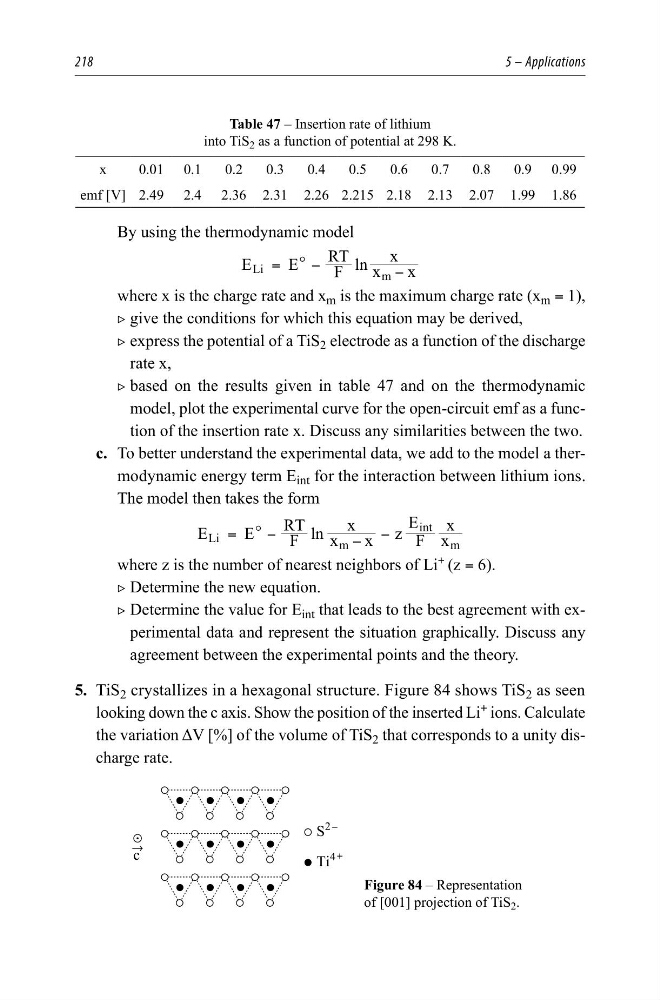
5. TiS 2 crystallizes in a hexagonal structure. Figure 84 shows TiS 2 as seen
looking down the c axis. Show the position of the inserted Li
+
ions. Calculate
the variation ΔV [%] of the volume of TiS 2 that corresponds to a unity discharge rate.
Figure 84 – Representation
of [001] projection of TiS 2 .
9
7L
6
<
ĺ
F
5 – Applications
Table 47 – Insertion rate of lithium
into TiS 2 as a function of potential at 298 K.
x
0.01 0.1
0.2
0.3
0.4
0.5
0.6
0.7
0.8
0.9 0.99
emf [V] 2.49 2.4 2.36 2.31 2.26 2.215 2.18 2.13 2.07 1.99 1.86
By using the thermodynamic model
ln
E
E
F
RT x
x
x
°
Li
m
=
−
−
where x is the charge rate and x m is the maximum charge rate (x m = 1),
2 give the conditions for which this equation may be derived,
2 express the potential of a TiS 2 electrode as a function of the discharge
rate x,
2 based on the results given in table 47 and on the thermodynamic
model, plot the experimental curve for the open-circuit emf as a function of the insertion rate x. Discuss any similarities between the two.
c. To better understand the experimental data, we add to the model a thermodynamic energy term E int for the interaction between lithium ions.
The model then takes the form
ln
E
E
F
RT
x
x
x
z F
E
x
x
°
int
Li
m
m
=
−
− −
where z is the number of nearest neighbors of Li
+
(z = 6).
2 Determine the new equation.
2 Determine the value for E int that leads to the best agreement with experimental data and represent the situation graphically. Discuss any
agreement between the experimental points and the theory.
5. TiS 2 crystallizes in a hexagonal structure. Figure 84 shows TiS 2 as seen
looking down the c axis. Show the position of the inserted Li
+
ions. Calculate
the variation ΔV [%] of the volume of TiS 2 that corresponds to a unity discharge rate.
Figure 84 – Representation
of [001] projection of TiS 2 .
9
7L
6
<
ĺ
F